







Alert & Filter Category
Intraday Stock Alerts by Time Frame
1 to 60 Minute Highs, Breakouts and Volume
Find stocks making 5, 10, 15, 30 and 60 minute highs and lows, opening range breakouts, consolidation breakouts, 1 minute volume spikes, MACD and stochastic crosses, and intraday candlestick patterns on the exact chart time frame you trade, with Trade Ideas Streaming Alerts (Scanner) and Top Lists (Screeners).
Every setup in this group, in real time.
Free account, just an email. No card. Live access for a limited time. See plans & pricing.
Key point
Searching for an intraday stock scanner or an intraday stock screener? In Trade Ideas, this is Streaming Alerts: every alert and filter here is tied to one fixed candle length, so a 30 minute high means a 30 minute chart.
Streaming Alerts push each alert the moment it fires, the Fixed Time Frame filters are checked at that same moment, and Top Lists can sort by them.
Settings
Fixed Time Frame alerts and filters are each tied to one set candle length, from 1 minute up to 120 minutes, plus a few multi-day ranges. That is the difference from alerts that look across many time frames at once: if you trade off a 15 minute chart, the 15 minute alert is checking the same 15 minute candles you are. This is the largest category in the Trade Ideas help, so the list below is grouped by setup, then by time frame.
How Trade Ideas finds it: 5 Minute High Alert (IDH5): by default, the 5 minute high alert appears when the price of a stock makes a new intraday high on a 5 minute candlestick chart. 5 Minute Opening Range Breakout Alert (ORU5): by default, the 5-minute opening range breakout alert is automatically triggered when a stock's price breaks above resistance for the first time during the trading day.

Find intraday highs, breakouts and volume by time frame
Stocks making 5, 10, 15, 30 and 60 minute highs and lows
New intraday highs and lows on one chart length. Find stocks making 5-minute highs as they print. IDH5 fires the first time the current 5 minute candle breaks the prior candle's high.
Alerts: 5 Minute High Alert (IDH5) 5 Minute Low Alert (IDL5) 10 Minute High Alert (IDH10) 10 Minute Low Alert (IDL10) 15 Minute High Alert (IDH15) 15 Minute Low Alert (IDL15) 30 Minute High Alert (IDH30) 30 Minute Low Alert (IDL30) 60 Minute High Alert (IDH60) 60 Minute Low Alert (IDL60)
Opening range breakouts and breakdowns (1 to 60 minute)
The first break above or below the opening range you pick. Find 5-minute opening range breakouts (ORB) as they happen. ORU5 fires the first time price tops the first 5 minute candle's high.
Alerts: 1 Minute Opening Range Breakout Alert (ORU1) 1 Minute Opening Range Breakdown Alert (ORD1) 2 Minute Opening Range Breakout Alert (ORU2) 2 Minute Opening Range Breakdown Alert (ORD2) 5 Minute Opening Range Breakout Alert (ORU5) 5 Minute Opening Range Breakdown Alert (ORD5) 10 Minute Opening Range Breakout Alert (ORU10) 10 Minute Opening Range Breakdown Alert (ORD10) 15 Minute Opening Range Breakout Alert (ORU15) 15 Minute Opening Range Breakdown Alert (ORD15) 30 Minute Opening Range Breakout Alert (ORU30) 30 Minute Opening Range Breakdown Alert (ORD30) 60 Minute Opening Range Breakout Alert (ORU60) 60 Minute Opening Range Breakdown Alert (ORD60)
Unusual volume in the last 1 to 30 minutes
The 1 minute volume spike alert, block trades, and volume-in-the-last-N-minutes filters. How Trade Ideas finds it: on the Volume (5 min) Filter (Vol5) page, to find stocks that have been trading at least 3 times as much as normal in the last 5 minutes, add the Volume (5 min) filter and enter 300 in the minimum field.
Alerts and filters: 1 Minute Volume Spike Alert (VS1) · Volume (1 min) Filter (Vol1) · Volume (5 min) Filter (Vol5) · Volume (10 min) Filter (Vol10) · Volume (15 min) Filter (Vol15) · Volume (30 min) Filter (Vol30)
Consolidation breakouts by time frame
Moves out of a consolidation range on 5 to 30 minute charts. How Trade Ideas finds it: on the 5 Minute Consolidation Breakout Alert (CBO5) page, by default, the 5 Minute Consolidation Breakout alert will appear when the stock price moves upward outside of the range of the consolidation pattern.
Alerts: 5 Minute Consolidation Breakout Alert (CBO5) 5 Minute Consolidation Breakdown Alert (CBD5) 10 Minute Consolidation Breakout Alert (CBO10) 10 Minute Consolidation Breakdown Alert (CBD10) 15 Minute Consolidation Breakout Alert (CBO15) 15 Minute Consolidation Breakdown Alert (CBD15) 30 Minute Consolidation Breakout Alert (CBO30) 30 Minute Consolidation Breakdown Alert (CBD30)
Stocks up or down in the last 5, 15 or 60 minutes
Settings
Price change over the last N minutes, in dollars or percent. How Trade Ideas finds it: on the Change (5 min, %) Filter (PUp5) page, you can set the minimum move to 10% to see only stocks which have gone up at least 10% in the last five minutes, and set the maximum to 10% and the minimum to -10% to see only stocks which have moved less than 10% in either direction in the last five minutes.
Filters: Change (1 min, $) Filter (DUp1) Change (1 min, %) Filter (PUp1) Change (2 min, $) Filter (DUp2) Change (2 min, %) Filter (PUp2) Change (5 min, $) Filter (DUp5) Change (5 min, %) Filter (PUp5) Change (10 min, $) Filter (DUp10) Change (10 min, %) Filter (PUp10) Change (15 min, $) Filter (DUp15) Change (15 min, %) Filter (PUp15) Change (30 min, $) Filter (DUp30) Change (30 min, %) Filter (PUp30) Change (60 min, $) Filter (DUp60) Change (60 min, %) Filter (PUp60) Change (120 min, $) Filter (DUp120) Change (120 min, %) Filter (PUp120)
Intraday range and consecutive candles
Settings
Range filters (in $ or %) and green or red candle streaks. How Trade Ideas finds it: on the Range (5 min, $) Filter (Range5) page, to find stocks with a 5-minute range of at least 50 cents, add the Range (5 min, $) filter and enter 0.5 in the minimum field. To find stocks with a 5-minute range of no more than $2, add the Range (5 min, $) filter and enter 2 in the maximum field.
Filters: Range (2 min, $) Filter (Range2) Range (2 min, %) Filter (Range2P) Range (5 min, $) Filter (Range5) Range (5 min, %) Filter (Range5P) Range (15 min, $) Filter (Range15) Range (15 min, %) Filter (Range15P) Range (30 min, $) Filter (Range30) Range (30 min, %) Filter (Range30P) Range (60 min, $) Filter (Range60) Range (60 min, %) Filter (Range60P) Range (120 min, $) Filter (Range120) Range (120 min, %) Filter (Range120P) Range (5 day, $) Filter (Range5D) Range (5 day, %) Filter (Range5DP) Range (10 day, $) Filter (Range10D) Range (10 day, %) Filter (Range10DP) Range (20 day, $) Filter (Range20D) Range (20 day, %) Filter (Range20DP) Consecutive Candles (1 min) Filter (Up1) Consecutive Candles (2 min) Filter (Up2) Consecutive Candles (5 min) Filter (Up5) Consecutive Candles (10 min) Filter (Up10) Consecutive Candles (15 min) Filter (Up15) Consecutive Candles (30 min) Filter (Up30) Consecutive Candles (60 min) Filter (Up60)
MACD, stochastic and moving average crosses on intraday charts
Indicator crosses checked on the chart length you pick. How Trade Ideas finds it: on the 5 Minute MACD Crossed Above Signal Alert (MDAS5) page, by default, this alert is triggered when the MACD crosses above the signal line on a 5 minute timeframe.
Alerts: Upward Thrust (2 Minute) Alert (SMAU2) Downward Thrust (2 Minute) Alert (SMAD2) Upward Thrust (5 Minute) Alert (SMAU5) Downward Thrust (5 Minute) Alert (SMAD5) Upward Thrust (15 Minute) Alert (SMAU15) Downward Thrust (15 Minute) Alert (SMAD15) 5 Period SMA Crossed Above 8 Period SMA (1 Minute) Alert (X5A8_1) 5 Period SMA Crossed Below 8 Period SMA (1 Minute) Alert (X5B8_1) 5 Period SMA Crossed Above 8 Period SMA (2 Minute) Alert (X5A8_2) 5 Period SMA Crossed Below 8 Period SMA (2 Minute) Alert (X5B8_2) 5 Period SMA Crossed Above 8 Period SMA (4 Minute) Alert (X5A8_4) 5 Period SMA Crossed Below 8 Period SMA (4 Minute) Alert (X5B8_4) 5 Period SMA Crossed Above 8 Period SMA (5 Minute) Alert (X5A8_5) 5 Period SMA Crossed Below 8 Period SMA (5 Minute) Alert (X5B8_5) 5 Period SMA Crossed Above 8 Period SMA (10 Minute) Alert (X5A8_10) 5 Period SMA Crossed Below 8 Period SMA (10 Minute) Alert (X5B8_10) 5 Period SMA Crossed Above 8 Period SMA (20 Minute) Alert (X5A8_20) 5 Period SMA Crossed Below 8 Period SMA (20 Minute) Alert (X5B8_20) 5 Period SMA Crossed Above 8 Period SMA (30 Minute) Alert (X5A8_30) 5 Period SMA Crossed Below 8 Period SMA (30 Minute) Alert (X5B8_30) 8 Period SMA Crossed Above 20 Period SMA (2 Minute) Alert (ECAY2) 8 Period SMA Crossed Below 20 Period SMA (2 Minute) Alert (ECBY2) 8 Period SMA Crossed Above 20 Period SMA (5 Minute) Alert (ECAY5) 8 Period SMA Crossed Below 20 Period SMA (5 Minute) Alert (ECBY5) 8 Period SMA Crossed Above 20 Period SMA (15 Minute) Alert (ECAY15) 8 Period SMA Crossed Below 20 Period SMA (15 Minute) Alert (ECBY15) 20 Period SMA Crossed Above 200 Period SMA (2 Minute) Alert (YCAD2) 20 Period SMA Crossed Below 200 Period SMA (2 Minute) Alert (YCBD2) 20 Period SMA Crossed Above 200 Period SMA (5 Minute) Alert (YCAD5) 20 Period SMA Crossed Below 200 Period SMA (5 Minute) Alert (YCBD5) 20 Period SMA Crossed Above 200 Period SMA (15 Minute) Alert (YCAD15) 20 Period SMA Crossed Below 200 Period SMA (15 Minute) Alert (YCBD15) 5 Minute MACD Crossed Above Signal Alert (MDAS5) 5 Minute MACD Crossed Below Signal Alert (MDBS5) 5 Minute MACD Crossed Above Zero Alert (MDAZ5) 5 Minute MACD Crossed Below Zero Alert (MDBZ5) 10 Minute MACD Crossed Above Signal Alert (MDAS10) 10 Minute MACD Crossed Below Signal Alert (MDBS10) 10 Minute MACD Crossed Above Zero Alert (MDAZ10) 10 Minute MACD Crossed Below Zero Alert (MDBZ10) 15 Minute MACD Crossed Above Signal Alert (MDAS15) 15 Minute MACD Crossed Below Signal Alert (MDBS15) 15 Minute MACD Crossed Above Zero Alert (MDAZ15) 15 Minute MACD Crossed Below Zero Alert (MDBZ15) 30 Minute MACD Crossed Above Signal Alert (MDAS30) 30 Minute MACD Crossed Below Signal Alert (MDBS30) 30 Minute MACD Crossed Above Zero Alert (MDAZ30) 30 Minute MACD Crossed Below Zero Alert (MDBZ30) 60 Minute MACD Crossed Above Signal Alert (MDAS60) 60 Minute MACD Crossed Below Signal Alert (MDBS60) 60 Minute MACD Crossed Above Zero Alert (MDAZ60) 60 Minute MACD Crossed Below Zero Alert (MDBZ60) 5 Minute Stochastic Crossed Above 20 Alert (SC20_5) 5 Minute Stochastic Crossed Below 80 Alert (SC80_5) 15 Minute Stochastic Crossed Above 20 Alert (SC20_15) 15 Minute Stochastic Crossed Below 80 Alert (SC80_15) 60 Minute Stochastic Crossed Above 20 Alert (SC20_60) 60 Minute Stochastic Crossed Below 80 Alert (SC80_60)
Intraday RSI, Bollinger Bands and market direction
Overbought and oversold readings by time frame, plus S&P, NASDAQ and Dow change filters as a market gate. How Trade Ideas finds it: on the RSI (5 min) Filter (RSI5) page, set the min 5 minute RSI to 70 to find stocks which are overbought on the 5 minute time frame.
Filters: NASDAQ Change (5 min) Filter (Qqqq5) NASDAQ Change (10 min) Filter (Qqqq10) NASDAQ Change (15 min) Filter (Qqqq15) NASDAQ Change (30 min) Filter (Qqqq30) S&P Change (5 min) Filter (Spy5) S&P Change (10 min) Filter (Spy10) S&P Change (15 min) Filter (Spy15) S&P Change (30 min) Filter (Spy30) Dow Change (5 min) Filter (Dia5) Dow Change (10 min) Filter (Dia10) Dow Change (15 min) Filter (Dia15) Dow Change (30 min) Filter (Dia30) RSI (1 min) Filter (RSI1) RSI (2 min) Filter (RSI2) RSI (5 min) Filter (RSI5) RSI (15 min) Filter (RSI15) RSI (60 min) Filter (RSI60) Position in Bollinger Bands (5 min) Filter (Boll5) Position in Bollinger Bands (15 min) Filter (Boll15) Position in Bollinger Bands (60 min) Filter (Boll60)
All 281 Fixed Time Frame alerts and filters
Fixed Time Frame alerts
Volume spike
- 1 Minute Volume Spike Alert (VS1): Find stocks with sudden 1-minute volume spikes as they happen. VS1 compares each minute's volume to the stock's own baseline for that time of day.
Consolidation breakout (4)
- 5 Minute Consolidation Breakout Alert (CBO5): Find 5-minute consolidation breakouts as they happen. CBO5 fires when price leaves the range on the 5 minute chart, with more alerts if the move keeps going.
- 10 Minute Consolidation Breakout Alert (CBO10): Find 10-minute consolidation breakouts as they happen. CBO10 fires when price leaves the range on the 10 minute chart, with more alerts if the move keeps going.
- 15 Minute Consolidation Breakout Alert (CBO15): Find 15-minute consolidation breakouts as they happen. CBO15 fires when price leaves the range on the 15 minute chart, with more alerts if the move keeps going.
- 30 Minute Consolidation Breakout Alert (CBO30): Find 30-minute consolidation breakouts as they happen. CBO30 fires when price leaves the range on the 30 minute chart, with more alerts if the move keeps going.
Consolidation breakdown (4)
- 5 Minute Consolidation Breakdown Alert (CBD5): Find 5-minute consolidation breakdowns as they happen. CBD5 fires when price leaves the range on the 5 minute chart, with more alerts if the move keeps going.
- 10 Minute Consolidation Breakdown Alert (CBD10): Find 10-minute consolidation breakdowns as they happen. CBD10 fires when price leaves the range on the 10 minute chart. Live in Trade Ideas Streaming Alerts.
- 15 Minute Consolidation Breakdown Alert (CBD15): Find 15-minute consolidation breakdowns as they happen. CBD15 fires when price leaves the range on the 15 minute chart. Live in Trade Ideas Streaming Alerts.
- 30 Minute Consolidation Breakdown Alert (CBD30): Find 30-minute consolidation breakdowns as they happen. CBD30 fires when price leaves the range on the 30 minute chart. Live in Trade Ideas Streaming Alerts.
New intraday high (5)
- 5 Minute High Alert (IDH5): Find stocks making 5-minute highs as they print. IDH5 fires the first time the current 5 minute candle breaks the prior candle's high.
- 10 Minute High Alert (IDH10): Find stocks making 10-minute highs as they print. IDH10 fires the first time the current 10 minute candle breaks the prior candle's high.
- 15 Minute High Alert (IDH15): Find stocks making 15-minute highs as they print. IDH15 fires the first time the current 15 minute candle breaks the prior candle's high.
- 30 Minute High Alert (IDH30): Find stocks making 30-minute highs as they print. IDH30 fires the first time the current 30 minute candle breaks the prior candle's high.
- 60 Minute High Alert (IDH60): Find stocks making 60-minute highs as they print. IDH60 fires the first time the current 60 minute candle breaks the prior candle's high.
New intraday low (5)
- 5 Minute Low Alert (IDL5): Find stocks making 5-minute lows as they print. IDL5 fires the first time the current 5 minute candle breaks the prior candle's low.
- 10 Minute Low Alert (IDL10): Find stocks making 10-minute lows as they print. IDL10 fires the first time the current 10 minute candle breaks the prior candle's low.
- 15 Minute Low Alert (IDL15): Find stocks making 15-minute lows as they print. IDL15 fires the first time the current 15 minute candle breaks the prior candle's low.
- 30 Minute Low Alert (IDL30): Find stocks making 30-minute lows as they print. IDL30 fires the first time the current 30 minute candle breaks the prior candle's low.
- 60 Minute Low Alert (IDL60): Find stocks making 60-minute lows as they print. IDL60 fires the first time the current 60 minute candle breaks the prior candle's low.
Opening range breakout (7)
- 1 Minute Opening Range Breakout Alert (ORU1): Find 1-minute opening range breakouts (ORB) as they happen. ORU1 fires the first time price tops the first 1 minute candle's high.
- 2 Minute Opening Range Breakout Alert (ORU2): Find 2-minute opening range breakouts (ORB) as they happen. ORU2 fires the first time price tops the first 2 minute candle's high.
- 5 Minute Opening Range Breakout Alert (ORU5): Find 5-minute opening range breakouts (ORB) as they happen. ORU5 fires the first time price tops the first 5 minute candle's high.
- 10 Minute Opening Range Breakout Alert (ORU10): Find 10-minute opening range breakouts (ORB) as they happen. ORU10 fires the first time price tops the first 10 minute candle's high.
- 15 Minute Opening Range Breakout Alert (ORU15): Find 15-minute opening range breakouts (ORB) as they happen. ORU15 fires the first time price tops the first 15 minute candle's high.
- 30 Minute Opening Range Breakout Alert (ORU30): Find 30-minute opening range breakouts (ORB) as they happen. ORU30 fires the first time price tops the first 30 minute candle's high.
- 60 Minute Opening Range Breakout Alert (ORU60): Find 60-minute opening range breakouts (ORB) as they happen. ORU60 fires the first time price tops the first 60 minute candle's high.
Opening range breakdown (7)
- 1 Minute Opening Range Breakdown Alert (ORD1): Find 1-minute opening range breakdowns (ORB) as they happen. ORD1 fires the first time price breaks the first 1 minute candle's low.
- 2 Minute Opening Range Breakdown Alert (ORD2): Find 2-minute opening range breakdowns (ORB) as they happen. ORD2 fires the first time price breaks the first 2 minute candle's low.
- 5 Minute Opening Range Breakdown Alert (ORD5): Find 5-minute opening range breakdowns (ORB) as they happen. ORD5 fires the first time price breaks the first 5 minute candle's low.
- 10 Minute Opening Range Breakdown Alert (ORD10): Find 10-minute opening range breakdowns (ORB) as they happen. ORD10 fires the first time price breaks the first 10 minute candle's low.
- 15 Minute Opening Range Breakdown Alert (ORD15): Find 15-minute opening range breakdowns (ORB) as they happen. ORD15 fires the first time price breaks the first 15 minute candle's low.
- 30 Minute Opening Range Breakdown Alert (ORD30): Find 30-minute opening range breakdowns (ORB) as they happen. ORD30 fires the first time price breaks the first 30 minute candle's low.
- 60 Minute Opening Range Breakdown Alert (ORD60): Find 60-minute opening range breakdowns (ORB) as they happen. ORD60 fires the first time price breaks the first 60 minute candle's low.
Linear regression up trend (4)
- 5 Minute Linear Regression Up Trend Alert (PEU5): Find stocks turning into a 5-minute linear regression uptrend as it happens. PEU5 compares short and long regression on the 5 minute chart.
- 15 Minute Linear Regression Up Trend Alert (PEU15): Find stocks turning into a 15-minute linear regression uptrend as it happens. PEU15 compares short and long regression on the 15 minute chart.
- 30 Minute Linear Regression Up Trend Alert (PEU30): Find stocks turning into a 30-minute linear regression uptrend as it happens. PEU30 compares short and long regression on the 30 minute chart.
- 90 Minute Linear Regression Up Trend Alert (PEU90): Find stocks turning into a 90-minute linear regression uptrend as it happens. PEU90 compares short and long regression on the 90 minute chart.
Linear regression down trend (4)
- 5 Minute Linear Regression Down Trend Alert (PED5): Find stocks turning into a 5-minute linear regression downtrend as it happens. PED5 compares short and long regression on the 5 minute chart.
- 15 Minute Linear Regression Down Trend Alert (PED15): Find stocks turning into a 15-minute linear regression downtrend as it happens. PED15 compares short and long regression on the 15 minute chart.
- 30 Minute Linear Regression Down Trend Alert (PED30): Find stocks turning into a 30-minute linear regression downtrend as it happens. PED30 compares short and long regression on the 30 minute chart.
- 90 Minute Linear Regression Down Trend Alert (PED90): Find stocks turning into a 90-minute linear regression downtrend as it happens. PED90 compares short and long regression on the 90 minute chart.
Upward thrust (3)
- Upward Thrust (2 Minute) Alert (SMAU2): Find stocks in a 2-minute upward thrust: 8 and 20 period SMAs both rising for 5 straight bars. SMAU2, as it happens. Live in Trade Ideas Streaming Alerts.
- Upward Thrust (5 Minute) Alert (SMAU5): Find stocks in a 5-minute upward thrust: 8 and 20 period SMAs both rising for 5 straight bars. SMAU5, as it happens. Live in Trade Ideas Streaming Alerts.
- Upward Thrust (15 Minute) Alert (SMAU15): Find stocks in a 15-minute upward thrust: 8 and 20 period SMAs both rising for 5 straight bars. SMAU15, as it happens. Live in Trade Ideas Streaming Alerts.
Downward thrust (3)
- Downward Thrust (2 Minute) Alert (SMAD2): Find stocks in a 2-minute downward thrust: 8 and 20 period SMAs both falling for 5 straight bars. SMAD2, as it happens. Live in Trade Ideas Streaming Alerts.
- Downward Thrust (5 Minute) Alert (SMAD5): Find stocks in a 5-minute downward thrust: 8 and 20 period SMAs both falling for 5 straight bars. SMAD5, as it happens. Live in Trade Ideas Streaming Alerts.
- Downward Thrust (15 Minute) Alert (SMAD15): Find stocks in a 15-minute downward thrust: 8 and 20 period SMAs both falling for 5 straight bars. SMAD15, as it happens.
5 period SMA crossed above 8 period SMA (7)
- 5 Period SMA Crossed Above 8 Period SMA (1 Minute) Alert (X5A8_1): Find bullish 5/8 SMA crossovers on the 1-minute chart as they happen. X5A8_1 fires when the 5 period SMA crosses above the 8.
- 5 Period SMA Crossed Above 8 Period SMA (2 Minute) Alert (X5A8_2): Find bullish 5/8 SMA crossovers on the 2-minute chart as they happen. X5A8_2 fires when the 5 period SMA crosses above the 8.
- 5 Period SMA Crossed Above 8 Period SMA (4 Minute) Alert (X5A8_4): Find bullish 5/8 SMA crossovers on the 4-minute chart as they happen. X5A8_4 fires when the 5 period SMA crosses above the 8.
- 5 Period SMA Crossed Above 8 Period SMA (5 Minute) Alert (X5A8_5): Find bullish 5/8 SMA crossovers on the 5-minute chart as they happen. X5A8_5 fires when the 5 period SMA crosses above the 8.
- 5 Period SMA Crossed Above 8 Period SMA (10 Minute) Alert (X5A8_10): Find bullish 5/8 SMA crossovers on the 10-minute chart as they happen. X5A8_10 fires when the 5 period SMA crosses above the 8.
- 5 Period SMA Crossed Above 8 Period SMA (20 Minute) Alert (X5A8_20): Find bullish 5/8 SMA crossovers on the 20-minute chart as they happen. X5A8_20 fires when the 5 period SMA crosses above the 8.
- 5 Period SMA Crossed Above 8 Period SMA (30 Minute) Alert (X5A8_30): Find bullish 5/8 SMA crossovers on the 30-minute chart as they happen. X5A8_30 fires when the 5 period SMA crosses above the 8.
5 period SMA crossed below 8 period SMA (7)
- 5 Period SMA Crossed Below 8 Period SMA (1 Minute) Alert (X5B8_1): Find bearish 5/8 SMA crossovers on the 1-minute chart as they happen. X5B8_1 fires when the 5 period SMA crosses below the 8.
- 5 Period SMA Crossed Below 8 Period SMA (2 Minute) Alert (X5B8_2): Find bearish 5/8 SMA crossovers on the 2-minute chart as they happen. X5B8_2 fires when the 5 period SMA crosses below the 8.
- 5 Period SMA Crossed Below 8 Period SMA (4 Minute) Alert (X5B8_4): Find bearish 5/8 SMA crossovers on the 4-minute chart as they happen. X5B8_4 fires when the 5 period SMA crosses below the 8.
- 5 Period SMA Crossed Below 8 Period SMA (5 Minute) Alert (X5B8_5): Find bearish 5/8 SMA crossovers on the 5-minute chart as they happen. X5B8_5 fires when the 5 period SMA crosses below the 8.
- 5 Period SMA Crossed Below 8 Period SMA (10 Minute) Alert (X5B8_10): Find bearish 5/8 SMA crossovers on the 10-minute chart as they happen. X5B8_10 fires when the 5 period SMA crosses below the 8.
- 5 Period SMA Crossed Below 8 Period SMA (20 Minute) Alert (X5B8_20): Find bearish 5/8 SMA crossovers on the 20-minute chart as they happen. X5B8_20 fires when the 5 period SMA crosses below the 8.
- 5 Period SMA Crossed Below 8 Period SMA (30 Minute) Alert (X5B8_30): Find bearish 5/8 SMA crossovers on the 30-minute chart as they happen. X5B8_30 fires when the 5 period SMA crosses below the 8.
8 period SMA crossed above 20 period SMA (3)
- 8 Period SMA Crossed Above 20 Period SMA (2 Minute) Alert (ECAY2): Find bullish 8/20 SMA crossovers on the 2-minute chart as they happen. ECAY2 fires when the 8 period SMA crosses above the 20.
- 8 Period SMA Crossed Above 20 Period SMA (5 Minute) Alert (ECAY5): Find bullish 8/20 SMA crossovers on the 5-minute chart as they happen. ECAY5 fires when the 8 period SMA crosses above the 20.
- 8 Period SMA Crossed Above 20 Period SMA (15 Minute) Alert (ECAY15): Find bullish 8/20 SMA crossovers on the 15-minute chart as they happen. ECAY15 fires when the 8 period SMA crosses above the 20.
8 period SMA crossed below 20 period SMA (3)
- 8 Period SMA Crossed Below 20 Period SMA (2 Minute) Alert (ECBY2): Find bearish 8/20 SMA crossovers on the 2-minute chart as they happen. ECBY2 fires when the 8 period SMA crosses below the 20.
- 8 Period SMA Crossed Below 20 Period SMA (5 Minute) Alert (ECBY5): Find bearish 8/20 SMA crossovers on the 5-minute chart as they happen. ECBY5 fires when the 8 period SMA crosses below the 20.
- 8 Period SMA Crossed Below 20 Period SMA (15 Minute) Alert (ECBY15): Find bearish 8/20 SMA crossovers on the 15-minute chart as they happen. ECBY15 fires when the 8 period SMA crosses below the 20.
20 period SMA crossed above 200 period SMA (3)
- 20 Period SMA Crossed Above 200 Period SMA (2 Minute) Alert (YCAD2): Find bullish 20/200 SMA crossovers on the 2-minute chart as they happen. YCAD2 fires when the 20 period SMA crosses above the 200.
- 20 Period SMA Crossed Above 200 Period SMA (5 Minute) Alert (YCAD5): Find bullish 20/200 SMA crossovers on the 5-minute chart as they happen. YCAD5 fires when the 20 period SMA crosses above the 200.
- 20 Period SMA Crossed Above 200 Period SMA (15 Minute) Alert (YCAD15): Find bullish 20/200 SMA crossovers on the 15-minute chart as they happen. YCAD15 fires when the 20 period SMA crosses above the 200.
20 period SMA crossed below 200 period SMA (3)
- 20 Period SMA Crossed Below 200 Period SMA (2 Minute) Alert (YCBD2): Find bearish 20/200 SMA crossovers on the 2-minute chart as they happen. YCBD2 fires when the 20 period SMA crosses below the 200.
- 20 Period SMA Crossed Below 200 Period SMA (5 Minute) Alert (YCBD5): Find bearish 20/200 SMA crossovers on the 5-minute chart as they happen. YCBD5 fires when the 20 period SMA crosses below the 200.
- 20 Period SMA Crossed Below 200 Period SMA (15 Minute) Alert (YCBD15): Find bearish 20/200 SMA crossovers on the 15-minute chart as they happen. YCBD15 fires when the 20 period SMA crosses below the 200.
MACD crossed above signal (5)
- 5 Minute MACD Crossed Above Signal Alert (MDAS5): Find stocks with a 5-minute MACD cross above the signal line as it happens. MDAS5 watches the 5 minute chart so you see the crossover in the session, not after.
- 10 Minute MACD Crossed Above Signal Alert (MDAS10): Find stocks with a 10-minute MACD cross above the signal line as it happens. MDAS10 watches the 10 minute chart. Live in Trade Ideas Streaming Alerts.
- 15 Minute MACD Crossed Above Signal Alert (MDAS15): Find stocks with a 15-minute MACD cross above the signal line as it happens. MDAS15 watches the 15 minute chart. Live in Trade Ideas Streaming Alerts.
- 30 Minute MACD Crossed Above Signal Alert (MDAS30): Find stocks with a 30-minute MACD cross above the signal line as it happens. MDAS30 watches the 30 minute chart. Live in Trade Ideas Streaming Alerts.
- 60 Minute MACD Crossed Above Signal Alert (MDAS60): Find stocks with a 60-minute MACD cross above the signal line as it happens. MDAS60 watches the 60 minute chart. Live in Trade Ideas Streaming Alerts.
MACD crossed below signal (5)
- 5 Minute MACD Crossed Below Signal Alert (MDBS5): Find stocks with a 5-minute MACD cross below the signal line as it happens. MDBS5 watches the 5 minute chart so you see the crossover in the session, not after.
- 10 Minute MACD Crossed Below Signal Alert (MDBS10): Find stocks with a 10-minute MACD cross below the signal line as it happens. MDBS10 watches the 10 minute chart. Live in Trade Ideas Streaming Alerts.
- 15 Minute MACD Crossed Below Signal Alert (MDBS15): Find stocks with a 15-minute MACD cross below the signal line as it happens. MDBS15 watches the 15 minute chart. Live in Trade Ideas Streaming Alerts.
- 30 Minute MACD Crossed Below Signal Alert (MDBS30): Find stocks with a 30-minute MACD cross below the signal line as it happens. MDBS30 watches the 30 minute chart. Live in Trade Ideas Streaming Alerts.
- 60 Minute MACD Crossed Below Signal Alert (MDBS60): Find stocks with a 60-minute MACD cross below the signal line as it happens. MDBS60 watches the 60 minute chart. Live in Trade Ideas Streaming Alerts.
MACD crossed above zero (5)
- 5 Minute MACD Crossed Above Zero Alert (MDAZ5): Find stocks with a 5-minute MACD cross above zero as it happens. MDAZ5 watches the 5 minute chart so you see the crossover in the session, not after.
- 10 Minute MACD Crossed Above Zero Alert (MDAZ10): Find stocks with a 10-minute MACD cross above zero as it happens. MDAZ10 watches the 10 minute chart so you see the crossover in the session, not after.
- 15 Minute MACD Crossed Above Zero Alert (MDAZ15): Find stocks with a 15-minute MACD cross above zero as it happens. MDAZ15 watches the 15 minute chart so you see the crossover in the session, not after.
- 30 Minute MACD Crossed Above Zero Alert (MDAZ30): Find stocks with a 30-minute MACD cross above zero as it happens. MDAZ30 watches the 30 minute chart so you see the crossover in the session, not after.
- 60 Minute MACD Crossed Above Zero Alert (MDAZ60): Find stocks with a 60-minute MACD cross above zero as it happens. MDAZ60 watches the 60 minute chart so you see the crossover in the session, not after.
MACD crossed below zero (5)
- 5 Minute MACD Crossed Below Zero Alert (MDBZ5): Find stocks with a 5-minute MACD cross below zero as it happens. MDBZ5 watches the 5 minute chart so you see the crossover in the session, not after.
- 10 Minute MACD Crossed Below Zero Alert (MDBZ10): Find stocks with a 10-minute MACD cross below zero as it happens. MDBZ10 watches the 10 minute chart so you see the crossover in the session, not after.
- 15 Minute MACD Crossed Below Zero Alert (MDBZ15): Find stocks with a 15-minute MACD cross below zero as it happens. MDBZ15 watches the 15 minute chart so you see the crossover in the session, not after.
- 30 Minute MACD Crossed Below Zero Alert (MDBZ30): Find stocks with a 30-minute MACD cross below zero as it happens. MDBZ30 watches the 30 minute chart so you see the crossover in the session, not after.
- 60 Minute MACD Crossed Below Zero Alert (MDBZ60): Find stocks with a 60-minute MACD cross below zero as it happens. MDBZ60 watches the 60 minute chart so you see the crossover in the session, not after.
Stochastic crossed above 20 (3)
- 5 Minute Stochastic Crossed Above 20 Alert (SC20_5): Find stocks crossing above 20 (leaving oversold) on the 5-minute stochastic, as it happens. SC20_5 filters noise near the line.
- 15 Minute Stochastic Crossed Above 20 Alert (SC20_15): Find stocks crossing above 20 (leaving oversold) on the 15-minute stochastic, as it happens. SC20_15 filters noise near the line.
- 60 Minute Stochastic Crossed Above 20 Alert (SC20_60): Find stocks crossing above 20 (leaving oversold) on the 60-minute stochastic, as it happens. SC20_60 filters noise near the line.
Stochastic crossed below 80 (3)
- 5 Minute Stochastic Crossed Below 80 Alert (SC80_5): Find stocks crossing below 80 (leaving overbought) on the 5-minute stochastic, as it happens. SC80_5 filters noise near the line.
- 15 Minute Stochastic Crossed Below 80 Alert (SC80_15): Find stocks crossing below 80 (leaving overbought) on the 15-minute stochastic, as it happens. SC80_15 filters noise near the line.
- 60 Minute Stochastic Crossed Below 80 Alert (SC80_60): Find stocks crossing below 80 (leaving overbought) on the 60-minute stochastic, as it happens. SC80_60 filters noise near the line.
Doji (5)
- 5 Minute Doji Alert (DOJ5): Find stocks forming a doji candlestick on the 5-minute chart as each candle completes. DOJ5 detects the pattern for you in Streaming Alerts.
- 10 Minute Doji Alert (DOJ10): Find stocks forming a doji candlestick on the 10-minute chart as each candle completes. DOJ10 detects the pattern for you in Streaming Alerts.
- 15 Minute Doji Alert (DOJ15): Find stocks forming a doji candlestick on the 15-minute chart as each candle completes. DOJ15 detects the pattern for you in Streaming Alerts.
- 30 Minute Doji Alert (DOJ30): Find stocks forming a doji candlestick on the 30-minute chart as each candle completes. DOJ30 detects the pattern for you in Streaming Alerts.
- 60 Minute Doji Alert (DOJ60): Find stocks forming a doji candlestick on the 60-minute chart as each candle completes. DOJ60 detects the pattern for you in Streaming Alerts.
Hammer (6)
- 2 Minute Hammer Alert (HMR2): Find stocks forming a hammer candlestick on the 2-minute chart as each candle completes. HMR2 detects the pattern for you in Streaming Alerts.
- 5 Minute Hammer Alert (HMR5): Find stocks forming a hammer candlestick on the 5-minute chart as each candle completes. HMR5 detects the pattern for you in Streaming Alerts.
- 10 Minute Hammer Alert (HMR10): Find stocks forming a hammer candlestick on the 10-minute chart as each candle completes. HMR10 detects the pattern for you in Streaming Alerts.
- 15 Minute Hammer Alert (HMR15): Find stocks forming a hammer candlestick on the 15-minute chart as each candle completes. HMR15 detects the pattern for you in Streaming Alerts.
- 30 Minute Hammer Alert (HMR30): Find stocks forming a hammer candlestick on the 30-minute chart as each candle completes. HMR30 detects the pattern for you in Streaming Alerts.
- 60 Minute Hammer Alert (HMR60): Find stocks forming a hammer candlestick on the 60-minute chart as each candle completes. HMR60 detects the pattern for you in Streaming Alerts.
Hanging man (6)
- 2 Minute Hanging Man Alert (HGM2): Find stocks forming a hanging man candlestick on the 2-minute chart as each candle completes. HGM2 detects the pattern for you in Streaming Alerts.
- 5 Minute Hanging Man Alert (HGM5): Find stocks forming a hanging man candlestick on the 5-minute chart as each candle completes. HGM5 detects the pattern for you in Streaming Alerts.
- 10 Minute Hanging Man Alert (HGM10): Find stocks forming a hanging man candlestick on the 10-minute chart as each candle completes. HGM10 detects the pattern for you in Streaming Alerts.
- 15 Minute Hanging Man Alert (HGM15): Find stocks forming a hanging man candlestick on the 15-minute chart as each candle completes. HGM15 detects the pattern for you in Streaming Alerts.
- 30 Minute Hanging Man Alert (HGM30): Find stocks forming a hanging man candlestick on the 30-minute chart as each candle completes. HGM30 detects the pattern for you in Streaming Alerts.
- 60 Minute Hanging Man Alert (HGM60): Find stocks forming a hanging man candlestick on the 60-minute chart as each candle completes. HGM60 detects the pattern for you in Streaming Alerts.
Bullish engulfing (4)
- 5 Minute Bullish Engulfing Alert (NGU5): Find stocks forming a bullish engulfing candlestick on the 5-minute chart as each candle completes. NGU5 detects the pattern for you in Streaming Alerts.
- 10 Minute Bullish Engulfing Alert (NGU10): Find stocks forming a bullish engulfing candlestick on the 10-minute chart as each candle completes. NGU10 detects the pattern for you in Streaming Alerts.
- 15 Minute Bullish Engulfing Alert (NGU15): Find stocks forming a bullish engulfing candlestick on the 15-minute chart as each candle completes. NGU15 detects the pattern for you in Streaming Alerts.
- 30 Minute Bullish Engulfing Alert (NGU30): Find stocks forming a bullish engulfing candlestick on the 30-minute chart as each candle completes. NGU30 detects the pattern for you in Streaming Alerts.
Bearish engulfing (4)
- 5 Minute Bearish Engulfing Alert (NGD5): Find stocks forming a bearish engulfing candlestick on the 5-minute chart as each candle completes. NGD5 detects the pattern for you in Streaming Alerts.
- 10 Minute Bearish Engulfing Alert (NGD10): Find stocks forming a bearish engulfing candlestick on the 10-minute chart as each candle completes. NGD10 detects the pattern for you in Streaming Alerts.
- 15 Minute Bearish Engulfing Alert (NGD15): Find stocks forming a bearish engulfing candlestick on the 15-minute chart as each candle completes. NGD15 detects the pattern for you in Streaming Alerts.
- 30 Minute Bearish Engulfing Alert (NGD30): Find stocks forming a bearish engulfing candlestick on the 30-minute chart as each candle completes. NGD30 detects the pattern for you in Streaming Alerts.
Piercing pattern (4)
- 5 Minute Piercing Pattern Alert (PP5): Find stocks forming a piercing pattern candlestick on the 5-minute chart as each candle completes. PP5 detects the pattern for you in Streaming Alerts.
- 10 Minute Piercing Pattern Alert (PP10): Find stocks forming a piercing pattern candlestick on the 10-minute chart as each candle completes. PP10 detects the pattern for you in Streaming Alerts.
- 15 Minute Piercing Pattern Alert (PP15): Find stocks forming a piercing pattern candlestick on the 15-minute chart as each candle completes. PP15 detects the pattern for you in Streaming Alerts.
- 30 Minute Piercing Pattern Alert (PP30): Find stocks forming a piercing pattern candlestick on the 30-minute chart as each candle completes. PP30 detects the pattern for you in Streaming Alerts.
Dark cloud cover (4)
- 5 Minute Dark Cloud Cover Alert (DCC5): Find stocks forming a dark cloud cover candlestick on the 5-minute chart as each candle completes. DCC5 detects the pattern for you in Streaming Alerts.
- 10 Minute Dark Cloud Cover Alert (DCC10): Find stocks forming a dark cloud cover candlestick on the 10-minute chart as each candle completes. DCC10 detects the pattern for you in Streaming Alerts.
- 15 Minute Dark Cloud Cover Alert (DCC15): Find stocks forming a dark cloud cover candlestick on the 15-minute chart as each candle completes. DCC15 detects the pattern for you in Streaming Alerts.
- 30 Minute Dark Cloud Cover Alert (DCC30): Find stocks forming a dark cloud cover candlestick on the 30-minute chart as each candle completes. DCC30 detects the pattern for you in Streaming Alerts.
Bottoming tail (6)
- 2 Minute Bottoming Tail Alert (BT2): Find stocks forming a bottoming tail candlestick on the 2-minute chart as each candle completes. BT2 detects the pattern for you in Streaming Alerts.
- 5 Minute Bottoming Tail Alert (BT5): Find stocks forming a bottoming tail candlestick on the 5-minute chart as each candle completes. BT5 detects the pattern for you in Streaming Alerts.
- 10 Minute Bottoming Tail Alert (BT10): Find stocks forming a bottoming tail candlestick on the 10-minute chart as each candle completes. BT10 detects the pattern for you in Streaming Alerts.
- 15 Minute Bottoming Tail Alert (BT15): Find stocks forming a bottoming tail candlestick on the 15-minute chart as each candle completes. BT15 detects the pattern for you in Streaming Alerts.
- 30 Minute Bottoming Tail Alert (BT30): Find stocks forming a bottoming tail candlestick on the 30-minute chart as each candle completes. BT30 detects the pattern for you in Streaming Alerts.
- 60 Minute Bottoming Tail Alert (BT60): Find stocks forming a bottoming tail candlestick on the 60-minute chart as each candle completes. BT60 detects the pattern for you in Streaming Alerts.
Topping tail (6)
- 2 Minute Topping Tail Alert (TT2): Find stocks forming a topping tail candlestick on the 2-minute chart as each candle completes. TT2 detects the pattern for you in Streaming Alerts.
- 5 Minute Topping Tail Alert (TT5): Find stocks forming a topping tail candlestick on the 5-minute chart as each candle completes. TT5 detects the pattern for you in Streaming Alerts.
- 10 Minute Topping Tail Alert (TT10): Find stocks forming a topping tail candlestick on the 10-minute chart as each candle completes. TT10 detects the pattern for you in Streaming Alerts.
- 15 Minute Topping Tail Alert (TT15): Find stocks forming a topping tail candlestick on the 15-minute chart as each candle completes. TT15 detects the pattern for you in Streaming Alerts.
- 30 Minute Topping Tail Alert (TT30): Find stocks forming a topping tail candlestick on the 30-minute chart as each candle completes. TT30 detects the pattern for you in Streaming Alerts.
- 60 Minute Topping Tail Alert (TT60): Find stocks forming a topping tail candlestick on the 60-minute chart as each candle completes. TT60 detects the pattern for you in Streaming Alerts.
Narrow range buy bar (4)
- 5 Minute Narrow Range Buy Bar Alert (NRBB5): Find stocks forming a narrow range buy bar candlestick on the 5-minute chart as each candle completes. NRBB5 detects the pattern for you in Streaming Alerts.
- 10 Minute Narrow Range Buy Bar Alert (NRBB10): Find stocks forming a narrow range buy bar candlestick on the 10-minute chart as each candle completes. NRBB10 detects the pattern for you in Streaming Alerts.
- 15 Minute Narrow Range Buy Bar Alert (NRBB15): Find stocks forming a narrow range buy bar candlestick on the 15-minute chart as each candle completes. NRBB15 detects the pattern for you in Streaming Alerts.
- 30 Minute Narrow Range Buy Bar Alert (NRBB30): Find stocks forming a narrow range buy bar candlestick on the 30-minute chart as each candle completes. NRBB30 detects the pattern for you in Streaming Alerts.
Narrow range sell bar (4)
- 5 Minute Narrow Range Sell Bar Alert (NRSB5): Find stocks forming a narrow range sell bar candlestick on the 5-minute chart as each candle completes. NRSB5 detects the pattern for you in Streaming Alerts.
- 10 Minute Narrow Range Sell Bar Alert (NRSB10): Find stocks forming a narrow range sell bar candlestick on the 10-minute chart as each candle completes. NRSB10 detects the pattern for you in Streaming Alerts.
- 15 Minute Narrow Range Sell Bar Alert (NRSB15): Find stocks forming a narrow range sell bar candlestick on the 15-minute chart as each candle completes. NRSB15 detects the pattern for you in Streaming Alerts.
- 30 Minute Narrow Range Sell Bar Alert (NRSB30): Find stocks forming a narrow range sell bar candlestick on the 30-minute chart as each candle completes. NRSB30 detects the pattern for you in Streaming Alerts.
Green bar reversal (4)
- 2 Minute Green Bar Reversal Alert (GBR2): Find stocks forming a green bar reversal candlestick on the 2-minute chart as each candle completes. GBR2 detects the pattern for you in Streaming Alerts.
- 5 Minute Green Bar Reversal Alert (GBR5): Find stocks forming a green bar reversal candlestick on the 5-minute chart as each candle completes. GBR5 detects the pattern for you in Streaming Alerts.
- 15 Minute Green Bar Reversal Alert (GBR15): Find stocks forming a green bar reversal candlestick on the 15-minute chart as each candle completes. GBR15 detects the pattern for you in Streaming Alerts.
- 60 Minute Green Bar Reversal Alert (GBR60): Find stocks forming a green bar reversal candlestick on the 60-minute chart as each candle completes. GBR60 detects the pattern for you in Streaming Alerts.
Red bar reversal (4)
- 2 Minute Red Bar Reversal Alert (RBR2): Find stocks forming a red bar reversal candlestick on the 2-minute chart as each candle completes. RBR2 detects the pattern for you in Streaming Alerts.
- 5 Minute Red Bar Reversal Alert (RBR5): Find stocks forming a red bar reversal candlestick on the 5-minute chart as each candle completes. RBR5 detects the pattern for you in Streaming Alerts.
- 15 Minute Red Bar Reversal Alert (RBR15): Find stocks forming a red bar reversal candlestick on the 15-minute chart as each candle completes. RBR15 detects the pattern for you in Streaming Alerts.
- 60 Minute Red Bar Reversal Alert (RBR60): Find stocks forming a red bar reversal candlestick on the 60-minute chart as each candle completes. RBR60 detects the pattern for you in Streaming Alerts.
1-2-3 continuation buy signal (4)
- 2 Minute 1-2-3 Continuation Buy Signal Alert (C1U_2): Find 2-minute 1-2-3 continuation buy signals as they form. C1U_2 fires as price clears the bar 1-2 extreme. Live in Trade Ideas Streaming Alerts.
- 5 Minute 1-2-3 Continuation Buy Signal Alert (C1U_5): Find 5-minute 1-2-3 continuation buy signals as they form. C1U_5 fires as price clears the bar 1-2 extreme. Live in Trade Ideas Streaming Alerts.
- 15 Minute 1-2-3 Continuation Buy Signal Alert (C1U_15): Find 15-minute 1-2-3 continuation buy signals as they form. C1U_15 fires as price clears the bar 1-2 extreme. Live in Trade Ideas Streaming Alerts.
- 60 Minute 1-2-3 Continuation Buy Signal Alert (C1U_60): Find 60-minute 1-2-3 continuation buy signals as they form. C1U_60 fires as price clears the bar 1-2 extreme. Live in Trade Ideas Streaming Alerts.
1-2-3 continuation sell signal (4)
- 2 Minute 1-2-3 Continuation Sell Signal Alert (C1D_2): Find 2-minute 1-2-3 continuation sell signals as they form. C1D_2 fires as price clears the bar 1-2 extreme. Live in Trade Ideas Streaming Alerts.
- 5 Minute 1-2-3 Continuation Sell Signal Alert (C1D_5): Find 5-minute 1-2-3 continuation sell signals as they form. C1D_5 fires as price clears the bar 1-2 extreme. Live in Trade Ideas Streaming Alerts.
- 15 Minute 1-2-3 Continuation Sell Signal Alert (C1D_15): Find 15-minute 1-2-3 continuation sell signals as they form. C1D_15 fires as price clears the bar 1-2 extreme. Live in Trade Ideas Streaming Alerts.
- 60 Minute 1-2-3 Continuation Sell Signal Alert (C1D_60): Find 60-minute 1-2-3 continuation sell signals as they form. C1D_60 fires as price clears the bar 1-2 extreme. Live in Trade Ideas Streaming Alerts.
1-2-3 continuation buy setup (4)
- 2 Minute 1-2-3 Continuation Buy Setup Alert (C1U_2S): Find 2-minute 1-2-3 continuation buy setups as they form. C1U_2S flags the pattern before the entry signal. Live in Trade Ideas Streaming Alerts.
- 5 Minute 1-2-3 Continuation Buy Setup Alert (C1U_5S): Find 5-minute 1-2-3 continuation buy setups as they form. C1U_5S flags the pattern before the entry signal. Live in Trade Ideas Streaming Alerts.
- 15 Minute 1-2-3 Continuation Buy Setup Alert (C1U_15S): Find 15-minute 1-2-3 continuation buy setups as they form. C1U_15S flags the pattern before the entry signal. Live in Trade Ideas Streaming Alerts.
- 60 Minute 1-2-3 Continuation Buy Setup Alert (C1U_60S): Find 60-minute 1-2-3 continuation buy setups as they form. C1U_60S flags the pattern before the entry signal. Live in Trade Ideas Streaming Alerts.
1-2-3 continuation sell setup (4)
- 2 Minute 1-2-3 Continuation Sell Setup Alert (C1D_2S): Find 2-minute 1-2-3 continuation sell setups as they form. C1D_2S flags the pattern before the entry signal. Live in Trade Ideas Streaming Alerts.
- 5 Minute 1-2-3 Continuation Sell Setup Alert (C1D_5S): Find 5-minute 1-2-3 continuation sell setups as they form. C1D_5S flags the pattern before the entry signal. Live in Trade Ideas Streaming Alerts.
- 15 Minute 1-2-3 Continuation Sell Setup Alert (C1D_15S): Find 15-minute 1-2-3 continuation sell setups as they form. C1D_15S flags the pattern before the entry signal. Live in Trade Ideas Streaming Alerts.
- 60 Minute 1-2-3 Continuation Sell Setup Alert (C1D_60S): Find 60-minute 1-2-3 continuation sell setups as they form. C1D_60S flags the pattern before the entry signal. Live in Trade Ideas Streaming Alerts.
Bullish opening power bar
- Bullish Opening Power Bar Alert (OVO5U): Find bullish 5-minute opening power bar triggers as they happen. OVO5U fires one tick above the high of a market-confirmed power bar.
Bearish opening power bar
- Bearish Opening Power Bar Alert (OVO5D): Find bearish 5-minute opening power bar triggers as they happen. OVO5D fires one tick below the low of a market-confirmed power bar.
NR7 (6)
- NR7 (1 Minute) Alert (NR7_1): Find stocks with an NR7 (narrowest range in 7 bars) on the 1-minute chart as each candle completes. NR7_1 also counts back-to-back NR7s (NR7-2, NR7-3).
- NR7 (2 Minute) Alert (NR7_2): Find stocks with an NR7 (narrowest range in 7 bars) on the 2-minute chart as each candle completes. NR7_2 also counts back-to-back NR7s (NR7-2, NR7-3).
- NR7 (5 Minute) Alert (NR7_5): Find stocks with an NR7 (narrowest range in 7 bars) on the 5-minute chart as each candle completes. NR7_5 also counts back-to-back NR7s (NR7-2, NR7-3).
- NR7 (10 Minute) Alert (NR7_10): Find stocks with an NR7 (narrowest range in 7 bars) on the 10-minute chart as each candle completes. NR7_10 also counts back-to-back NR7s (NR7-2, NR7-3).
- NR7 (15 Minute) Alert (NR7): Find stocks with an NR7 (narrowest range in 7 bars) on the 15-minute chart as each candle completes. NR7 also counts back-to-back NR7s (NR7-2, NR7-3).
- NR7 (30 Minute) Alert (NR7_30): Find stocks with an NR7 (narrowest range in 7 bars) on the 30-minute chart as each candle completes. NR7_30 also counts back-to-back NR7s (NR7-2, NR7-3).
Wide range bar (3)
- 2 Minute Wide Range Bar Alert (WRB2): Find stocks forming a wide range bar candlestick on the 2-minute chart as each candle completes. WRB2 detects the pattern for you in Streaming Alerts.
- 5 Minute Wide Range Bar Alert (WRB5): Find stocks forming a wide range bar candlestick on the 5-minute chart as each candle completes. WRB5 detects the pattern for you in Streaming Alerts.
- 15 Minute Wide Range Bar Alert (WRB15): Find stocks forming a wide range bar candlestick on the 15-minute chart as each candle completes. WRB15 detects the pattern for you in Streaming Alerts.
Fixed Time Frame filters
Volume (5)
- Volume (1 min) Filter (Vol1): Find stocks with a volume spike in the last 1 minute. 300 means three times the volume expected for 1 minute, based on the 10-day average.
- Volume (5 min) Filter (Vol5): Find stocks with a volume spike in the last 5 minutes. 300 means three times the volume expected for 5 minutes, based on the 10-day average.
- Volume (10 min) Filter (Vol10): Find stocks with a volume spike in the last 10 minutes. 300 means three times the volume expected for 10 minutes, based on the 10-day average.
- Volume (15 min) Filter (Vol15): Find stocks with a volume spike in the last 15 minutes. 300 means three times the volume expected for 15 minutes, based on the 10-day average.
- Volume (30 min) Filter (Vol30): Find stocks with a volume spike in the last 30 minutes. 300 means three times the volume expected for 30 minutes, based on the 10-day average.
Range (12)
- Range (2 min, $) Filter (Range2): Find stocks with the widest 2-minute range right now: the high minus the low over the last 2 minutes, in dollars. Spot fast intraday movers.
- Range (2 min, %) Filter (Range2P): Find stocks with the widest 2-minute range right now: the high minus the low over the last 2 minutes, as a percent of price. Spot fast intraday movers.
- Range (5 min, $) Filter (Range5): Find stocks with the widest 5-minute range right now: the high minus the low over the last 5 minutes, in dollars. Spot fast intraday movers.
- Range (5 min, %) Filter (Range5P): Find stocks with the widest 5-minute range right now: the high minus the low over the last 5 minutes, as a percent of price. Spot fast intraday movers.
- Range (15 min, $) Filter (Range15): Find stocks with the widest 15-minute range right now: the high minus the low over the last 15 minutes, in dollars. Spot fast intraday movers.
- Range (15 min, %) Filter (Range15P): Find stocks with the widest 15-minute range right now: the high minus the low over the last 15 minutes, as a percent of price. Spot fast intraday movers.
- Range (30 min, $) Filter (Range30): Find stocks with the widest 30-minute range right now: the high minus the low over the last 30 minutes, in dollars. Spot fast intraday movers.
- Range (30 min, %) Filter (Range30P): Find stocks with the widest 30-minute range right now: the high minus the low over the last 30 minutes, as a percent of price. Spot fast intraday movers.
- Range (60 min, $) Filter (Range60): Find stocks with the widest 60-minute range right now: the high minus the low over the last 60 minutes, in dollars. Spot fast intraday movers.
- Range (60 min, %) Filter (Range60P): Find stocks with the widest 60-minute range right now: the high minus the low over the last 60 minutes, as a percent of price. Spot fast intraday movers.
- Range (120 min, $) Filter (Range120): Find stocks with the widest 120-minute range right now: the high minus the low over the last 120 minutes, in dollars. Spot fast intraday movers.
- Range (120 min, %) Filter (Range120P): Find stocks with the widest 120-minute range right now: the high minus the low over the last 120 minutes, as a percent of price. Spot fast intraday movers.
Day Range (6)
- Range (5 day, $) Filter (Range5D): Find stocks with a wide or narrow 5-day trading range in dollars: the high minus the low of the previous 5 trading days, not counting today.
- Range (5 day, %) Filter (Range5DP): Find stocks with a wide or narrow 5-day trading range as a percent of price: the high minus the low of the previous 5 trading days, not counting today.
- Range (10 day, $) Filter (Range10D): Find stocks with a wide or narrow 10-day trading range in dollars: the high minus the low of the previous 10 trading days, not counting today.
- Range (10 day, %) Filter (Range10DP): Find stocks with a wide or narrow 10-day trading range as a percent of price: the high minus the low of the previous 10 trading days, not counting today.
- Range (20 day, $) Filter (Range20D): Find stocks with a wide or narrow 20-day trading range in dollars: the high minus the low of the previous 20 trading days, not counting today.
- Range (20 day, %) Filter (Range20DP): Find stocks with a wide or narrow 20-day trading range as a percent of price: the high minus the low of the previous 20 trading days, not counting today.
Consecutive Candles (7)
- Consecutive Candles (1 min) Filter (Up1): Find stocks with 3 or more green (or red) 1-minute candles in a row. Enter 3 as the minimum for green streaks, or -3 as the maximum for red.
- Consecutive Candles (2 min) Filter (Up2): Find stocks with 3 or more green (or red) 2-minute candles in a row. Enter 3 as the minimum for green streaks, or -3 as the maximum for red.
- Consecutive Candles (5 min) Filter (Up5): Find stocks with 3 or more green (or red) 5-minute candles in a row. Enter 3 as the minimum for green streaks, or -3 as the maximum for red.
- Consecutive Candles (10 min) Filter (Up10): Find stocks with 3 or more green (or red) 10-minute candles in a row. Enter 3 as the minimum for green streaks, or -3 as the maximum for red.
- Consecutive Candles (15 min) Filter (Up15): Find stocks with 3 or more green (or red) 15-minute candles in a row. Enter 3 as the minimum for green streaks, or -3 as the maximum for red.
- Consecutive Candles (30 min) Filter (Up30): Find stocks with 3 or more green (or red) 30-minute candles in a row. Enter 3 as the minimum for green streaks, or -3 as the maximum for red.
- Consecutive Candles (60 min) Filter (Up60): Find stocks with 3 or more green (or red) 60-minute candles in a row. Enter 3 as the minimum for green streaks, or -3 as the maximum for red.
Change (16)
- Change (1 min, $) Filter (DUp1): Find stocks moving up or down fast in the last 1 minute, in dollars. Set a minimum to see gainers or a maximum to see drops, in real time.
- Change (1 min, %) Filter (PUp1): Find stocks moving up or down fast in the last 1 minute, in percent. Set a minimum to see gainers or a maximum to see drops, in real time.
- Change (2 min, $) Filter (DUp2): Find stocks moving up or down fast in the last 2 minutes, in dollars. Set a minimum to see gainers or a maximum to see drops, in real time.
- Change (2 min, %) Filter (PUp2): Find stocks moving up or down fast in the last 2 minutes, in percent. Set a minimum to see gainers or a maximum to see drops, in real time.
- Change (5 min, $) Filter (DUp5): Find stocks moving up or down fast in the last 5 minutes, in dollars. Set a minimum to see gainers or a maximum to see drops, in real time.
- Change (5 min, %) Filter (PUp5): Find stocks moving up or down fast in the last 5 minutes, in percent. Set a minimum to see gainers or a maximum to see drops, in real time.
- Change (10 min, $) Filter (DUp10): Find stocks moving up or down fast in the last 10 minutes, in dollars. Set a minimum to see gainers or a maximum to see drops, in real time.
- Change (10 min, %) Filter (PUp10): Find stocks moving up or down fast in the last 10 minutes, in percent. Set a minimum to see gainers or a maximum to see drops, in real time.
- Change (15 min, $) Filter (DUp15): Find stocks moving up or down fast in the last 15 minutes, in dollars. Set a minimum to see gainers or a maximum to see drops, in real time.
- Change (15 min, %) Filter (PUp15): Find stocks moving up or down fast in the last 15 minutes, in percent. Set a minimum to see gainers or a maximum to see drops, in real time.
- Change (30 min, $) Filter (DUp30): Find stocks moving up or down fast in the last 30 minutes, in dollars. Set a minimum to see gainers or a maximum to see drops, in real time.
- Change (30 min, %) Filter (PUp30): Find stocks moving up or down fast in the last 30 minutes, in percent. Set a minimum to see gainers or a maximum to see drops, in real time.
- Change (60 min, $) Filter (DUp60): Find stocks moving up or down fast in the last 60 minutes, in dollars. Set a minimum to see gainers or a maximum to see drops, in real time.
- Change (60 min, %) Filter (PUp60): Find stocks moving up or down fast in the last 60 minutes, in percent. Set a minimum to see gainers or a maximum to see drops, in real time.
- Change (120 min, $) Filter (DUp120): Find stocks moving up or down fast in the last 120 minutes, in dollars. Set a minimum to see gainers or a maximum to see drops, in real time.
- Change (120 min, %) Filter (PUp120): Find stocks moving up or down fast in the last 120 minutes, in percent. Set a minimum to see gainers or a maximum to see drops, in real time.
NASDAQ Change (4)
- NASDAQ Change (5 min) Filter (Qqqq5): Get alerts only when the NASDAQ 100 is moving your way over the last 5 minutes. Every stock gets the same value, so it works as a market-direction filter.
- NASDAQ Change (10 min) Filter (Qqqq10): Get alerts only when the NASDAQ 100 is moving your way over the last 10 minutes. Every stock gets the same value, so it works as a market-direction filter.
- NASDAQ Change (15 min) Filter (Qqqq15): Get alerts only when the NASDAQ 100 is moving your way over the last 15 minutes. Every stock gets the same value, so it works as a market-direction filter.
- NASDAQ Change (30 min) Filter (Qqqq30): Get alerts only when the NASDAQ 100 is moving your way over the last 30 minutes. Every stock gets the same value, so it works as a market-direction filter.
S&P Change (4)
- S&P Change (5 min) Filter (Spy5): Get alerts only when the S&P 500 is moving your way over the last 5 minutes. Every stock gets the same value, so it works as a market-direction filter.
- S&P Change (10 min) Filter (Spy10): Get alerts only when the S&P 500 is moving your way over the last 10 minutes. Every stock gets the same value, so it works as a market-direction filter.
- S&P Change (15 min) Filter (Spy15): Get alerts only when the S&P 500 is moving your way over the last 15 minutes. Every stock gets the same value, so it works as a market-direction filter.
- S&P Change (30 min) Filter (Spy30): Get alerts only when the S&P 500 is moving your way over the last 30 minutes. Every stock gets the same value, so it works as a market-direction filter.
Dow Change (4)
- Dow Change (5 min) Filter (Dia5): Get alerts only when the Dow Jones Industrial Average is moving your way over the last 5 minutes. Live in Trade Ideas Streaming Alerts.
- Dow Change (10 min) Filter (Dia10): Get alerts only when the Dow Jones Industrial Average is moving your way over the last 10 minutes. Live in Trade Ideas Streaming Alerts.
- Dow Change (15 min) Filter (Dia15): Get alerts only when the Dow Jones Industrial Average is moving your way over the last 15 minutes. Live in Trade Ideas Streaming Alerts.
- Dow Change (30 min) Filter (Dia30): Get alerts only when the Dow Jones Industrial Average is moving your way over the last 30 minutes. Live in Trade Ideas Streaming Alerts.
Intraday RSI (5)
- RSI (1 min) Filter (RSI1): Find overbought and oversold stocks on the 1-minute chart. RSI runs 0 to 100: a max of 30 finds oversold stocks, a min of 70 finds overbought ones.
- RSI (2 min) Filter (RSI2): Find overbought and oversold stocks on the 2-minute chart. RSI runs 0 to 100: a max of 30 finds oversold stocks, a min of 70 finds overbought ones.
- RSI (5 min) Filter (RSI5): Find overbought and oversold stocks on the 5-minute chart. RSI runs 0 to 100: a max of 30 finds oversold stocks, a min of 70 finds overbought ones.
- RSI (15 min) Filter (RSI15): Find overbought and oversold stocks on the 15-minute chart. RSI runs 0 to 100: a max of 30 finds oversold stocks, a min of 70 finds overbought ones.
- RSI (60 min) Filter (RSI60): Find overbought and oversold stocks on the 60-minute chart. RSI runs 0 to 100: a max of 30 finds oversold stocks, a min of 70 finds overbought ones.
Position in Bollinger Bands (3)
- Position in Bollinger Bands (5 min) Filter (Boll5): Find stocks trading at or outside their 5-minute Bollinger Bands. 0 = touching the lower band, 100 = the upper band; a min of 90 finds stretched stocks.
- Position in Bollinger Bands (15 min) Filter (Boll15): Find stocks trading at or outside their 15-minute Bollinger Bands. 0 = touching the lower band, 100 = the upper band; a min of 90 finds stretched stocks.
- Position in Bollinger Bands (60 min) Filter (Boll60): Find stocks trading at or outside their 60-minute Bollinger Bands. 0 = touching the lower band, 100 = the upper band; a min of 90 finds stretched stocks.
Change from 5 Period SMA (3)
- Change From 5 Period SMA (2 min) Filter (2SmaLa5): Find stocks trading above or below the 5-period SMA on the 2-minute chart, in percent. Min 1 = above the average; max -1 = below it.
- Change From 5 Period SMA (5 min) Filter (5SmaLa5): Find stocks trading above or below the 5-period SMA on the 5-minute chart, in percent. Min 1 = above the average; max -1 = below it.
- Change From 5 Period SMA (15 min) Filter (15SmaLa5): Find stocks trading above or below the 5-period SMA on the 15-minute chart, in percent. Min 1 = above the average; max -1 = below it.
Change from 8 Period SMA (4)
- Change From 8 Period SMA (2 min) Filter (2SmaLa8): Find stocks trading above or below the 8-period SMA on the 2-minute chart, in percent. Min 1 = above the average; max -1 = below it.
- Change From 8 Period SMA (5 min) Filter (5SmaLa8): Find stocks trading above or below the 8-period SMA on the 5-minute chart, in percent. Min 1 = above the average; max -1 = below it.
- Change From 8 Period SMA (15 min) Filter (15SmaLa8): Find stocks trading above or below the 8-period SMA on the 15-minute chart, in percent. Min 1 = above the average; max -1 = below it.
- Change From 8 Period SMA (60 min) Filter (60SmaLa8): Find stocks trading above or below the 8-period SMA on the 60-minute chart, in percent. Min 1 = above the average; max -1 = below it.
Change from 10 Period SMA (4)
- Change From 10 Period SMA (2 min) Filter (2SmaLa10): Find stocks trading above or below the 10-period SMA on the 2-minute chart, in percent. Min 1 = above the average; max -1 = below it.
- Change From 10 Period SMA (5 min) Filter (5SmaLa10): Find stocks trading above or below the 10-period SMA on the 5-minute chart, in percent. Min 1 = above the average; max -1 = below it.
- Change From 10 Period SMA (15 min) Filter (15SmaLa10): Find stocks trading above or below the 10-period SMA on the 15-minute chart, in percent. Min 1 = above the average; max -1 = below it.
- Change From 10 Period SMA (60 min) Filter (60SmaLa10): Find stocks trading above or below the 10-period SMA on the 60-minute chart, in percent. Min 1 = above the average; max -1 = below it.
Change from 20 Period SMA (4)
- Change From 20 Period SMA (2 min) Filter (2SmaLa20): Find stocks trading above or below the 20-period SMA on the 2-minute chart, in percent. Min 1 = above the average; max -1 = below it.
- Change From 20 Period SMA (5 min) Filter (5SmaLa20): Find stocks trading above or below the 20-period SMA on the 5-minute chart, in percent. Min 1 = above the average; max -1 = below it.
- Change From 20 Period SMA (15 min) Filter (15SmaLa20): Find stocks trading above or below the 20-period SMA on the 15-minute chart, in percent. Min 1 = above the average; max -1 = below it.
- Change From 20 Period SMA (60 min) Filter (60SmaLa20): Find stocks trading above or below the 20-period SMA on the 60-minute chart, in percent. Min 1 = above the average; max -1 = below it.
Change from 200 Period SMA (4)
- Change From 200 Period SMA (2 min) Filter (2SmaLa200): Find stocks trading above or below the 200-period SMA on the 2-minute chart, in percent. Min 1 = above the average; max -1 = below it.
- Change From 200 Period SMA (5 min) Filter (5SmaLa200): Find stocks trading above or below the 200-period SMA on the 5-minute chart, in percent. Min 1 = above the average; max -1 = below it.
- Change From 200 Period SMA (15 min) Filter (15SmaLa200): Find stocks trading above or below the 200-period SMA on the 15-minute chart, in percent. Min 1 = above the average; max -1 = below it.
- Change From 200 Period SMA (60 min) Filter (60SmaLa200): Find stocks trading above or below the 200-period SMA on the 60-minute chart, in percent. Min 1 = above the average; max -1 = below it.
Change from 130 Period SMA
- Change From 130 Period SMA (15 min) Filter (15SmaLa130): Find stocks trading above or below the 130-period SMA on the 15-minute chart, in percent. Min 1 = above the average; max -1 = below it.
8 vs. 20 Period SMA (4)
- 8 vs. 20 Period SMA (2 min) Filter (2Sma8a20): Find stocks where the 8-period SMA is above (or below) the 20-period SMA on the 2-minute chart. Min 1 = 8 above 20; max -1 = below.
- 8 vs. 20 Period SMA (5 min) Filter (5Sma8a20): Find stocks where the 8-period SMA is above (or below) the 20-period SMA on the 5-minute chart. Min 1 = 8 above 20; max -1 = below.
- 8 vs. 20 Period SMA (15 min) Filter (15Sma8a20): Find stocks where the 8-period SMA is above (or below) the 20-period SMA on the 15-minute chart. Min 1 = 8 above 20; max -1 = below.
- 8 vs. 20 Period SMA (60 min) Filter (60Sma8a20): Find stocks where the 8-period SMA is above (or below) the 20-period SMA on the 60-minute chart. Min 1 = 8 above 20; max -1 = below.
20 vs. 200 Period SMA (4)
- 20 vs. 200 Period SMA (2 min) Filter (2Sma20a200): Find stocks where the 20-period SMA is above (or below) the 200-period SMA on the 2-minute chart. Min 1 = 20 above 200; max -1 = below.
- 20 vs. 200 Period SMA (5 min) Filter (5Sma20a200): Find stocks where the 20-period SMA is above (or below) the 200-period SMA on the 5-minute chart. Min 1 = 20 above 200; max -1 = below.
- 20 vs. 200 Period SMA (15 min) Filter (15Sma20a200): Find stocks where the 20-period SMA is above (or below) the 200-period SMA on the 15-minute chart. Min 1 = 20 above 200; max -1 = below.
- 20 vs. 200 Period SMA (60 min) Filter (60Sma20a200): Find stocks where the 20-period SMA is above (or below) the 200-period SMA on the 60-minute chart. Min 1 = 20 above 200; max -1 = below.
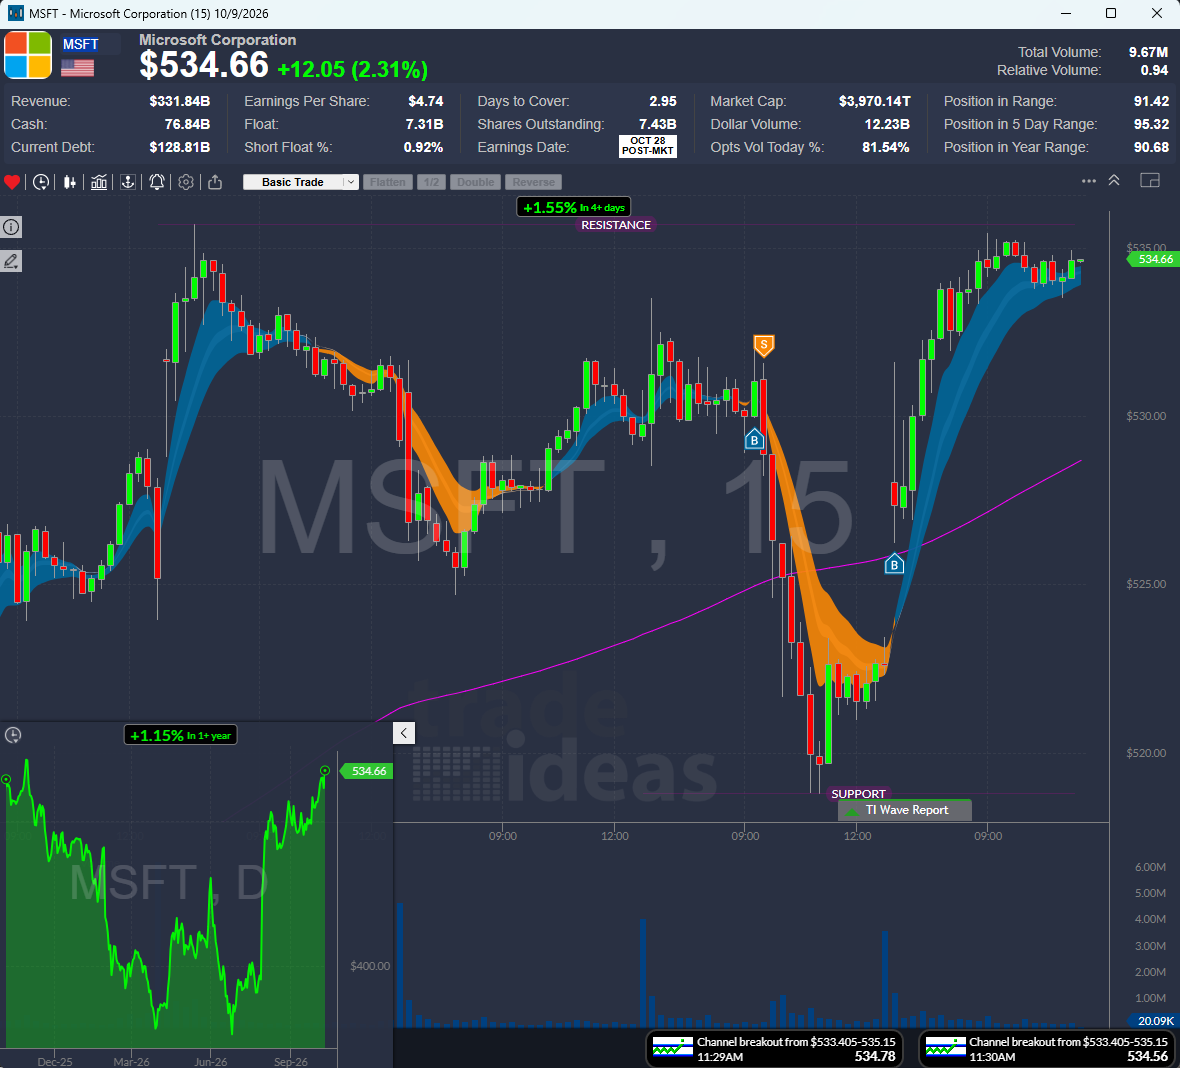
Filters to narrow Fixed Time Frame alerts
- Relative Volume Filter (RV): Find stocks with high relative volume today. A ratio of 1 is normal for this time of day, 2.5 is 2.5x normal. Watch them in real time in Streaming Alerts.
- Position Of Open Filter (POORP): Find stocks that opened above yesterday's high (100.1+) or at or below yesterday's low (0 max). Position of Open places today's open in yesterday's range.
- Change From The Open (%) Filter (FOP): Find stocks up or down the most since today's open, in percent. Set a minimum of 3 to see stocks up at least 3% from the open, as they move.
- Gap (%) Filter (GUP): Find stocks gapping up or down today by percent, so a $2 gap on a $10 stock ranks above the same gap on a $100 stock. Set 5 for 5%+ gap ups.
- Position in Range Filter (RD): Find stocks trading at the high or low of the day. Position in Range places the last print in today's range: 100 = at the high, 0 = at the low.
- Consolidation Filter (ConDays): Find stocks consolidating in a tight range on the daily chart, by days. Min 7 = strong consolidation; up to 40 days reported; keep max 25 for normal ones.
- Position in Consolidation Filter (RCon): Find stocks breaking out of a consolidation range. 0 to 100 = still inside it; a min of 100.01 = broke above it; 0 to 15 = in the bottom 15%.
- Linear Regression Divergence Filter (LR130): Find stocks moving in a clean, straight trend. Linear Regression Divergence runs 0 to 1: 0 is a perfectly straight line; a max of .25 finds strong trends.
Test it before you trade it

Don’t roll the dice. Test the odds. OddsMaker · TI Premium
Run any Fixed Time Frame setup through OddsMakerTI Premium, the Trade Ideas backtesting tool: event-based backtesting across thousands of stocks, with no coding. Prefer finished trade ideas to building your own? Holly, the Trade Ideas AI, publishes its own signals: Holly AI signalsTI Premium.
Related categories
- End of Candle Alerts (102 shared)
- Candlestick Pattern Alerts (88 shared)
- Single Print Stock Alerts (66 shared)
- Moving Average Crossover Alerts and Filters (60 shared)
- Stocks Moving Fast Right Now (32 shared)
- All alert and filter categories
FAQ
Which stocks are breaking their 5-minute opening range right now?
Turn on the 5 Minute High Alert (IDH5) in Trade Ideas Streaming Alerts. By default, the 5 minute high alert appears when the price of a stock makes a new intraday high on a 5 minute candlestick chart. Related: 5 Minute Low Alert (IDL5), 10 Minute High Alert (IDH10), 10 Minute Low Alert (IDL10), 15 Minute High Alert (IDH15).
What are Fixed Time Frame alerts and filters?
Fixed Time Frame alerts and filters are each tied to one set candle length, from 1 minute up to 120 minutes, plus a few multi-day ranges. That is the difference from alerts that look across many time frames at once: if you trade off a 15 minute chart, the 15 minute alert is checking the same 15 minute candles you are. This is the largest category in the Trade Ideas help, so the list below is grouped by setup, then by time frame.
How do I get alerts when a stock makes a new 30-minute high?
Use the 5 Minute Opening Range Breakout Alert (ORU5). By default, the 5-minute opening range breakout alert is automatically triggered when a stock's price breaks above resistance for the first time during the trading day.
How many alerts and filters are in the Fixed Time Frame category?
The Fixed Time Frame category has 187 alerts and 94 filters (281 in all). Each one links to its own help page with default settings and examples.
Is there an intraday stock scanner that works in real time?
Yes. In Trade Ideas, it is Streaming Alerts: every alert and filter here is tied to one fixed candle length, so a 30 minute high means a 30 minute chart. Each alert reaches you the moment it fires, not on the next refresh.
Can I backtest Fixed Time Frame alerts before I trade them?
Yes. OddsMakerTI Premium, the Trade Ideas backtesting tool, runs event-based backtests on alert-based strategies across thousands of stocks, with no coding. Pick a Fixed Time Frame alert as the entry, add filters, and see how the strategy would have done.