







 2Sma20a200
Filter
20 Vs. 200 Period SMA (2m) Filter (2Sma20a200)
Find stocks where the 20-period SMA is above, or below, the 200-period SMA on the 2-minute chart, in real time, with Trade Ideas Streaming Alerts (Scanner) and Top Lists (Screeners). The 20 vs. 200 Period SMA (2 min) filter compares two simple moving averages on a 2-minute chart, in percent. Positive means the 20-period SMA is above the 200-period SMA.
See the cross when it happens, not on tomorrow’s chart.
Free account, just an email. No card. Live access for a limited time.

Streaming Alerts check the 20 vs. 200 Period SMA (2 min) filter the moment each alert fires, and Top Lists can sort by it.
How Trade Ideas finds it: adjust the minimum value to 1 to see only stocks in which the 20-period SMA is above the 200 Period SMA on a 2 minute chart. Set the maximum value to -1 to focus only on stocks in which the 20-period SMA is below the 200 Period SMA on a 2 minute chart. See Trade Ideas plans and pricing to run it live.
How the 20 vs. 200 Period SMA (2 min) filter works
The "20 vs. 200 Period SMA (2 min)" filter in stock trading compares two different Simple Moving Averages (SMA) calculated on a 2-minute chart. SMAs are popular technical indicators used by traders to assess the direction and strength of a stock's price trend.
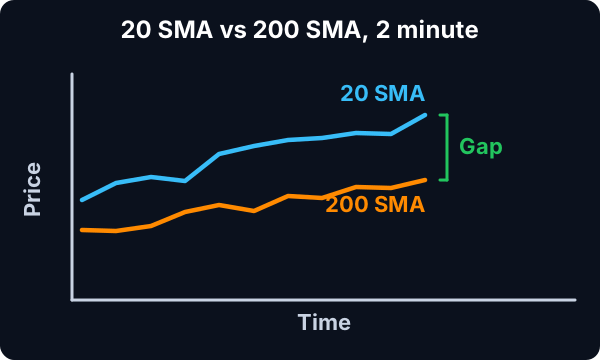
Here's how this filter works:
- Simple Moving Average (SMA): The SMA is calculated by averaging the closing prices of a stock over a specified period. In this filter, two SMAs are employed: a 20-period SMA and a 200-period SMA.
- Comparison: The 20-period SMA represents the short-term trend, considering a shorter time frame of price data. Conversely, the 200-period SMA represents the long-term trend, considering a longer time frame of price data. By comparing these two SMAs, traders gain insights into the relationship between short-term and long-term trends in the stock's price movement. The number is always expressed as a percentage.
- Signal Generation: When the 20-period SMA crosses above the 200-period SMA, it may indicate a bullish signal, suggesting that short-term momentum is increasing relative to long-term momentum. This is often referred to as a "golden cross" and is considered a bullish indicator. Conversely, when the 20-period SMA crosses below the 200-period SMA, it may indicate a bearish signal, suggesting that short-term momentum is decreasing relative to long-term momentum. This is known as a "death cross" and is considered a bearish indicator.
- Interpretation: Traders can use these crossover signals to make trading decisions. For example, a bullish crossover may signal a potential entry point for long positions, while a bearish crossover may signal a potential entry point for short positions. Additionally, the relative positioning of the two SMAs can provide insights into the strength and duration of the prevailing trend.
- Chart Representation: On a 2-minute chart, each candlestick represents price action that occurred over a 2-minute period. The SMAs are plotted on the chart, allowing traders to visually identify crossovers and trend dynamics.
20 vs. 200 Period SMA (2 min) filter settings
Configuring the "20 vs. 200 Period SMA (2 min) Filter" is simple and can be done within the Window Specific Filters Tab of the Configuration Window in your Alert or Top List (Screener) window.
Here's how to set up the filter in your configuration window:
- Adjust the minimum value to 1 to see only stocks in which the 20-period SMA is above the 200 Period SMA on a 2 minute chart.
- Set the maximum value to -1 to focus only on stocks in which the 20-period SMA is below the 200 Period SMA on a 2 minute chart.

Using the 20 vs. 200 Period SMA (2 min) Filter
The "20 vs. 200 Period SMA (2 min)" filter can be used in various trading strategies, including:
- Crossover Strategy: Traders often utilize crossover signals between the 20-period SMA and the 200-period SMA to identify potential entry and exit points. They may buy when the 20-period SMA crosses above the 200-period SMA (golden cross) and sell when the 20-period SMA crosses below the 200-period SMA (death cross).
- Trend Confirmation Strategy: Traders may use the relative positioning of the two SMAs to confirm the prevailing trend. If the 20-period SMA consistently remains above the 200-period SMA, it confirms a bullish trend. Conversely, if the 20-period SMA consistently remains below the 200-period SMA, it confirms a bearish trend. Traders may enter positions in alignment with the confirmed trend direction.
- Pullback Strategy: After a crossover signal occurs, traders may wait for a pullback in the price to retest the crossover point. If the price holds above the crossover point during the pullback in a bullish scenario or below the crossover point in a bearish scenario, traders may consider it a potential entry point in the direction of the crossover signal.
Filters to combine with 20 vs. 200 Period SMA (2 min)
Alerts to pair with the 20 vs. 200 Period SMA (2 min) filter
Categories
FAQ
Which stocks have the 20 SMA above the 200 SMA on the 2-minute chart?
Add the 20 vs. 200 Period SMA (2 min) filter (2Sma20a200) to a Trade Ideas Streaming Alerts or Top List (Screener) window. Adjust the minimum value to 1 to see only stocks in which the 20-period SMA is above the 200 Period SMA on a 2 minute chart. Set the maximum value to -1 to focus only on stocks in which the 20-period SMA is below the 200 Period SMA on a 2 minute chart.
What is the 20 vs. 200 Period SMA (2 min) filter?
The 20 vs. 200 Period SMA (2 min) filter compares two simple moving averages on a 2-minute chart, in percent. Positive means the 20-period SMA is above the 200-period SMA.
How do I scan for moving average crossovers intraday?
Use the 20 vs. 200 Period SMA (2 min) filter (2Sma20a200) in Trade Ideas Streaming Alerts and Top Lists to find stocks where the 20-period SMA is above, or below, the 200-period SMA on the 2-minute chart. The 20 vs.