







 HGM5
▼ Bearish
Streaming Alert (Scanner)
5 Minute Hanging Man Alert (HGM5)
By Daniel Mirkin, CEO, Trade Ideas. Updated October 2026.
Find stocks printing a hanging man candle on the 5-minute chart in real time with Trade Ideas Streaming Alerts (Scanner). A hanging man is a hammer-shaped candle that appears in an uptrend; most traders read it as a bearish reversal. This alert checks 5 minute candles.
Candle patterns as they form.
Free account, just an email. No card. Live access for a limited time.


Streaming Alerts show a hanging man the moment it completes, not on the next refresh.
How Trade Ideas finds it: by default, the 5 minute hanging man alert appears when there is a traditional hanging man pattern on a standard 5 minute candlestick chart. See Trade Ideas plans and pricing to run it live.
What is a hanging man candle?
A hanging man has the same shape as a hammer: small body up top, long lower tail. The difference is where it shows up. A hanging man forms after a run up.
The long tail means sellers got a real push in during the candle, even though price closed near the high. Traders see that as an early warning, not a sell signal on its own.
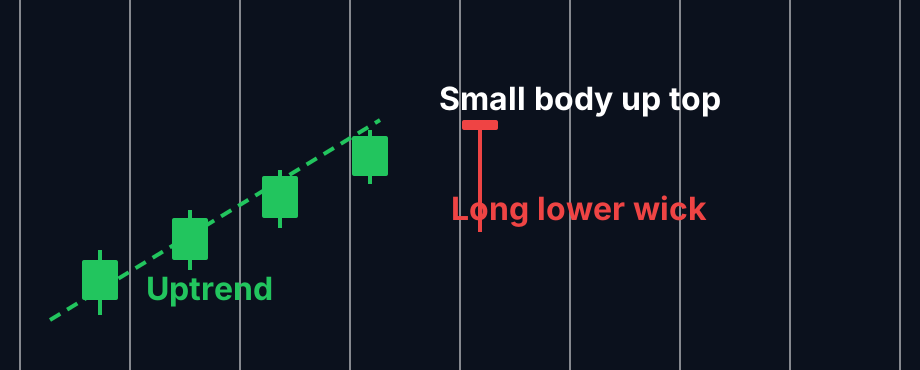
Parts of a hanging man
The run up
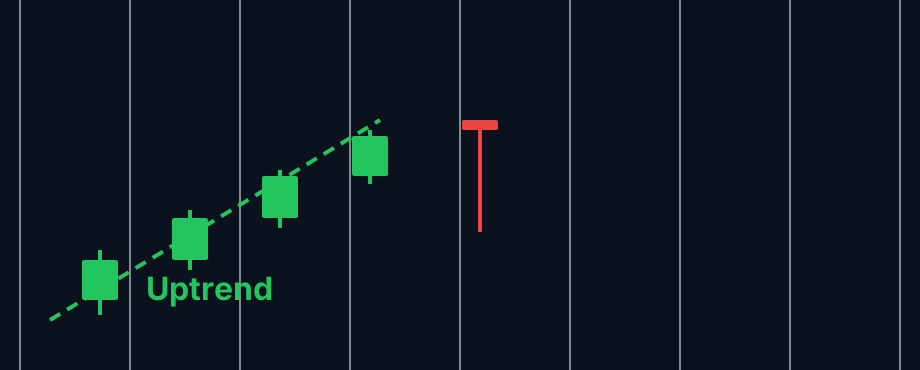
The candles before it are rising. That context is what makes it a hanging man.
Long tail below
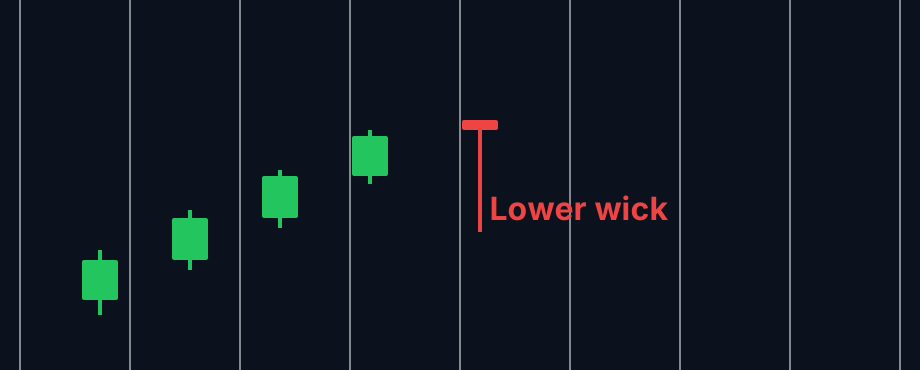
During the candle the stock dropped well under its open before buyers lifted it back.
Body near the high
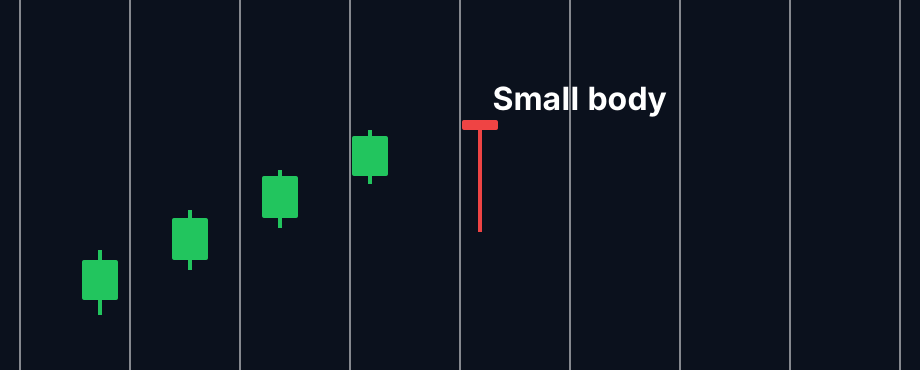
The open and close are close together near the top of the candle.
How traders use it
Step 1: Let the Trade Ideas alert find it
Turn on the 5 Minute Hanging Man alert (HGM5). It scans finished 5 minute candles and looks for this shape after an uptrend. See it live in the Web Dashboard.
Step 2: Wait for the trigger
Trader tip
Most traders wait for the next candle to close below the hanging man's body before they read it as a top.
Step 3: Entry
Traders who own the stock may take some profit. Short sellers usually want that lower close first.
Step 4: Exit
For a short, a stop above the hanging man's high is typical. That is the usual way it is handled, not advice.
Tips
- On its own a hanging man fails a lot. Confirmation matters more here than with most candles.
- It means more after a long, extended run.
- Watch for a gap down on the next candle.
- The mirror pattern is the 5 Minute Hammer (HMR5).
Past results, including backtests, are not indicative of future results.
How the 5 Minute Hanging Man alert works
This alert reports when there is a traditional hanging man pattern on a standard 5-minute candlestick chart. A hanging man is similar to a hammer, except that a hanging man occurs in an uptrend. We associate this alert with the color red because most traders see a hanging man as a reversal pattern.
Default settings
Settings
By default, the 5 minute hanging man alert appears when there is a traditional hanging man pattern on a standard 5 minute candlestick chart.
Custom settings
Settings
For '5 Minute Hanging Man' alerts, you have the option to use an alert specific filter. This filter is located immediately to the right of the corresponding alert and is always optional. You can decide to leave it blank if you want to receive more alerts, or you can fill it in to restrict the number of alerts you receive. This filter allows you to specify the quality of the alert. When you set a higher number for this filter, you are telling the alerts server to display only alerts that meet a higher quality standard, resulting in fewer alerts being shown.
When setting an alert for '5 Minute Hanging Man', the user can filter these alerts by a grade of how on how closely the stock chart matches the ideal shape of the stock pattern. 0 would mean there was no match. 100 would mean it's an ideal match.

What the alert shows you
The description of the alert will give a more comprehensive breakdown of the alert.

Key point
The quality value on a scan using the "5 Minute Hanging Man" represents the grade based on how closely the stock chart matches the ideal shape of the stock pattern. 0% would mean that there was no match at all. Of course, if a stock pattern is this poor a match, then we are unlikely to report an alert. 100% would be an ideal match. Again, this would be an ideal and extreme case. Few if any alerts come close to 100%.

Related alerts
Filters to pair with the 5 Minute Hanging Man alert
Categories
FAQ
Which stocks are forming a hanging man candle on the 5 minute chart right now?
Turn on the 5 Minute Hanging Man alert (HGM5) in Trade Ideas Streaming Alerts. By default, the 5 minute hanging man alert appears when there is a traditional hanging man pattern on a standard 5 minute candlestick chart.
What is the 5 Minute Hanging Man alert?
A hanging man is a hammer-shaped candle that appears in an uptrend; most traders read it as a bearish reversal. This alert checks 5 minute candles.
How do I see fewer, higher-quality 5 Minute Hanging Man alerts?
Use the optional alert-specific filter immediately to the right of the alert. A higher number tells the alerts server to show only higher-quality alerts, so fewer appear. Leave it blank to see more.
What is the opposite of the 5 Minute Hanging Man alert?
Is a hanging man bearish?
It is read as a possible bearish reversal, but only after the next candle confirms it.
How do you tell a hanging man from a hammer?
By the trend before it. Up into the candle means hanging man. Down into it means hammer.
Should I sell on a hanging man?
Some traders tighten stops or trim. Many wait for a lower close the next candle. This is a decision for your own plan.
What timeframes does Trade Ideas offer for the hanging man?
2, 5, 10, 15, 30 and 60 minute versions.