







 SC20_5
▲ Bullish
Streaming Alert (Scanner)
5 Minute Stochastic Crossed Above 20 Alert (SC20_5)
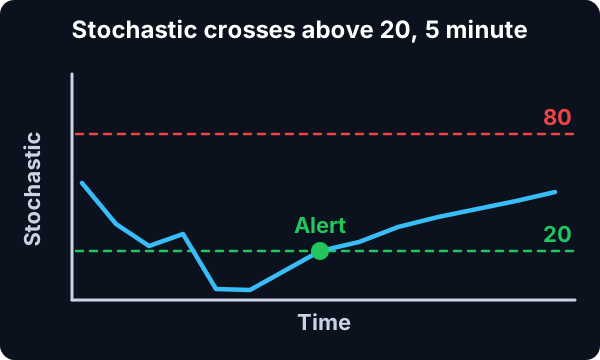
Find stocks leaving stochastic oversold territory on the 5-minute chart in real time with Trade Ideas Streaming Alerts (Scanner). Stochastics treat readings below 20 as oversold and above 80 as overbought. This alert fires as soon as a stock is no longer oversold, crossing back above 20.
See the cross when it happens, not on tomorrow’s chart.
Free account, just an email. No card. Live access for a limited time.


Streaming Alerts push each 5 Minute Stochastic Crossed Above 20 alert on the print that triggers it.
How Trade Ideas finds it: by default, this alert is triggered when the fast %K line of the Stochastic Oscillator crosses above the value of 20 on a 5-minute chart. See Trade Ideas plans and pricing to run it live.
How the 5 Minute Stochastic Crossed Above 20 alert works
These alerts track the stochastics for a stock on a 5, 15, or 60 minute chart. If the stochastics say that the a stock is overbought, the server reports an alert as soon as the stock is no longer overbought. If the stochastics say that the a stock is oversold, the server reports an alert as soon as the stock is no longer over sold.
The formula watches the 80 and 20 lines to determine overbought and oversold. It reports as soon as the %D for the fast stochastic or the %K for the slow stochastic crosses the line. We use our own proprietary analytics to filter out noise when the stochastic is hovering near a line, constantly crossing back and forth.
Here's how traders interpret and use the "Stochastic Crossed Above" alert:
-
Understanding Stochastic Oscillator:
The stochastic oscillator consists of two lines: %K and %D. The %K line is the fast line, representing the current closing price relative to the range of prices over a specified period. The %D line is the slow line and is typically a 3-period simple moving average of %K.
-
Definition of "Stochastic Crossed Above":
The alert is triggered when the fast %K line crosses above the slow %D line.
-
Bullish Signal:
A "Stochastic Crossed Above" alert is considered a bullish signal. It suggests that the current closing price is gaining strength relative to the recent price range, indicating potential upward momentum.
-
Confirmation of Buying Pressure:
The crossing of the fast %K line above the slow %D line is interpreted as a sign of increasing buying pressure. Traders view this as an indication that the recent price trend may have more room to move upward.
-
Potential Entry Signal:
Traders may use the "Stochastic Crossed Above" alert as a potential entry signal for long positions or as confirmation to hold existing long positions. It signals that the market conditions may be favorable for buying.
-
Consideration of Other Factors:
While the "Stochastic Crossed Above" alert is a bullish signal, traders often consider it in conjunction with other technical indicators, chart patterns, and overall market conditions for a more comprehensive view.
-
Adaptability to Different Timeframes:
The "Stochastic Crossed Above" alert is applicable across various timeframes, making it adaptable for different trading styles and investment horizons.
This alert is signaled by an individual print. We do not wait for the end of the candle to report it. This means that we report the condition sooner. It also means that a historical chart might not always match the alerts.
Default settings
Example
By default, this alert is triggered when the fast %K line of the Stochastic Oscillator crosses above the value of 20 on a 5-minute chart. To align with each alert, it's essential to utilize the corresponding time frame on the chart. For instance, this alert is visualized on the 5-minute candlestick chart.
Stochastic Indicator Formula
The most common setting for the stochastic oscillator involves using a 14-period lookback or calculation period.
Formula
The formula for the stochastic oscillator involves the following steps:
- Calculate the closing price's highest high and lowest low over the specified period (e.g., 14 periods).
- Use these values to calculate the %K line, representing the current closing price's position relative to the range.
Apply a moving average (typically a 3-period simple moving average) to smooth the %K line and generate the %D line.
Settings
The 14-period setting is considered a standard default, but traders may adjust it based on their preferences or the specific market conditions they are analyzing. Some traders may use shorter or longer periods depending on their trading strategy and the timeframe of their analysis. It's essential to consider the specific goals and characteristics of your trading strategy when choosing the period for the stochastic oscillator.
What the alert shows you
The description column of this scan will display "No Longer Oversold", providing you with a clear indication of the specific alert that has been triggered.

Related alerts
Filters to pair with the 5 Minute Stochastic Crossed Above 20 alert
Categories
FAQ
Which stocks are coming out of stochastic oversold on the 5 minute chart?
Turn on the 5 Minute Stochastic Crossed Above 20 alert (SC20_5) in Trade Ideas Streaming Alerts. By default, this alert is triggered when the fast %K line of the Stochastic Oscillator crosses above the value of 20 on a 5-minute chart.
What is the 5 Minute Stochastic Crossed Above 20 alert?
Stochastics treat readings below 20 as oversold and above 80 as overbought. This alert fires as soon as a stock is no longer oversold, crossing back above 20.