







 PP5
▲ Bullish
Streaming Alert (Scanner)
5 Minute Piercing Pattern Alert (PP5)
By Daniel Mirkin, CEO, Trade Ideas. Updated October 2026.
Find stocks printing a piercing pattern candle on the 5-minute chart in real time with Trade Ideas Streaming Alerts (Scanner). A piercing pattern is a green candle that opens below the prior red candle and closes above its midpoint. This alert checks 5 minute candles.
Candle patterns as they form.
Free account, just an email. No card. Live access for a limited time.


Streaming Alerts show a piercing pattern the moment it completes, not on the next refresh.
How Trade Ideas finds it: by default, the 5 minute piercing pattern alert appears when there is a piercing pattern on a 5 minute candlestick chart. See Trade Ideas plans and pricing to run it live.
What is a piercing pattern?
A piercing pattern is two candles at the end of a drop. A long red candle is followed by a green candle that opens below the red close, then climbs to finish above the halfway point of that red body.
Buyers did not take back all of the loss, but they took back more than half, which is what traders notice.
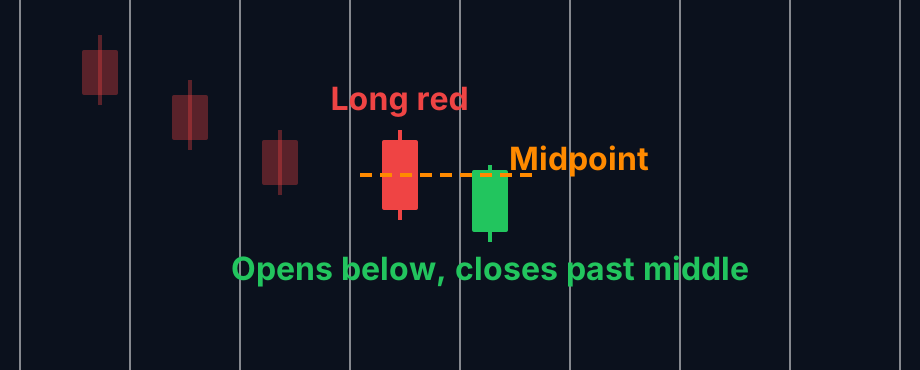
Parts of a piercing pattern
Long red candle
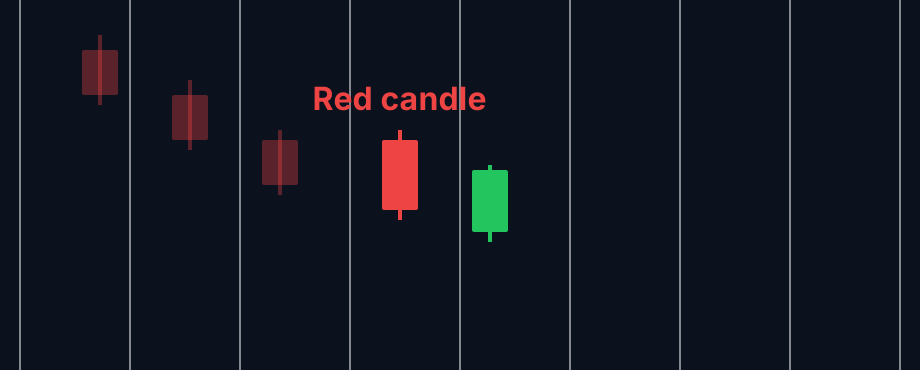
A strong down candle continuing the decline.
Open lower
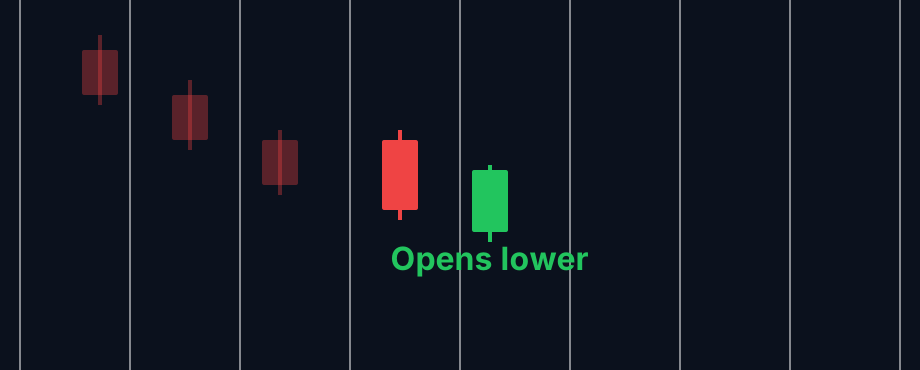
The green candle opens even lower. For a moment it looks like more selling.
Close above the midpoint
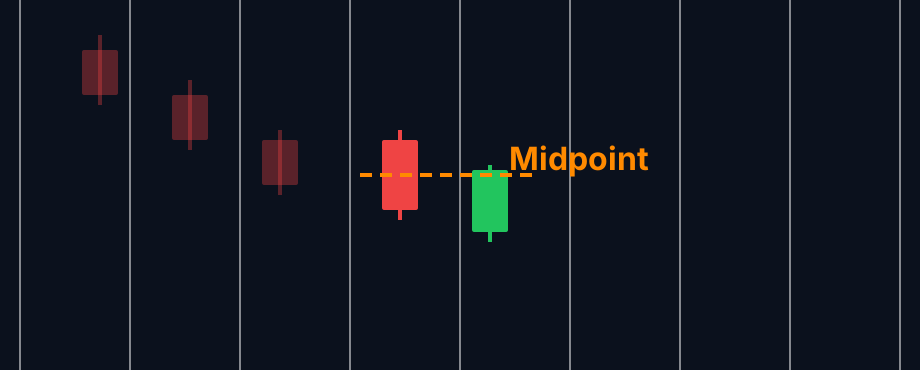
Then it rallies and closes past the halfway mark of the red body.
How traders use it
Step 1: Let the Trade Ideas alert find it
Turn on the 5 Minute Piercing Pattern alert (PP5). Trade Ideas spots the pair on finished 5 minute candles. See it live in the Web Dashboard.
Step 2: Wait for the trigger
Key point
A common trigger is the next candle trading above the green candle's high.
Step 3: Entry
Some buy the green close. Others wait for that next-candle confirmation.
Step 4: Exit
The low of the green candle is the usual stop. That is a typical approach, not advice.
Tips
- A close near the top of the red body is stronger than one just past the middle.
- Look for it near support or the low of the day.
- If the green candle closes above the red open, it is an engulfing pattern instead.
- The bearish counterpart is Dark Cloud Cover (DCC5).
Past results, including backtests, are not indicative of future results.
How the 5 Minute Piercing Pattern alert works
This alert signals the appearance of a piercing pattern on a traditional 5-minute candlestick chart. Components of a piercing pattern include:
- The first candlestick is typically a red or bearish candlestick, indicating a downward price movement
- The second candlestick is a green or bullish candlestick, indicating an upward price movement
- The bullish candlestick "pierces" the body of the first one, opening below the previous candle and closing above the midpoint of the previous bearish candle.
This pattern suggests a shift in market sentiment from bearish to bullish, as buyers have started to exert control.
Default settings
By default, the 5 minute piercing pattern alert appears when there is a piercing pattern on a 5 minute candlestick chart.
Custom settings
Settings
For '5 Minute Piercing Pattern' alerts, you have the option to use an alert specific filter. This filter is located immediately to the right of the corresponding alert and is always optional. You can decide to leave it blank if you want to receive more alerts, or you can fill it in to restrict the number of alerts you receive. This filter allows you to specify the quality of the alert. When you set a higher number for this filter, you are telling the alerts server to display only alerts that meet a higher quality standard, resulting in fewer alerts being shown.
When setting an alert for '5 Minute Piercing Pattern', the user can filter these alerts by a grade of how on how closely the stock chart matches the ideal shape of the stock pattern. 0 would mean there was no match. 100 would mean it's an ideal match.

What the alert shows you
The description of the alert will give a more comprehensive breakdown of the alert.

Key point
The quality value on a scan using the "5 Minute Piercing Pattern" represents the grade based on how closely the stock chart matches the ideal shape of the stock pattern. 0% would mean that there was no match at all. Of course, if a stock pattern is this poor a match, then we are unlikely to report an alert. 100% would be an ideal match. Again, this would be an ideal and extreme case. Few if any alerts come close to 100%.

Related alerts
Filters to pair with the 5 Minute Piercing Pattern alert
Categories
FAQ
Which stocks are forming a piercing pattern candle on the 5 minute chart right now?
Turn on the 5 Minute Piercing Pattern alert (PP5) in Trade Ideas Streaming Alerts. By default, the 5 minute piercing pattern alert appears when there is a piercing pattern on a 5 minute candlestick chart.
What is the 5 Minute Piercing Pattern alert?
A piercing pattern is a green candle that opens below the prior red candle and closes above its midpoint. This alert checks 5 minute candles.
How do I see fewer, higher-quality 5 Minute Piercing Pattern alerts?
Use the optional alert-specific filter immediately to the right of the alert. A higher number tells the alerts server to show only higher-quality alerts, so fewer appear. Leave it blank to see more.
What is the opposite of the 5 Minute Piercing Pattern alert?
Is a piercing pattern bullish?
Yes. Traders see it as a sign a decline may be ending.
What is the difference between piercing and bullish engulfing?
A piercing candle closes past the middle of the red body. An engulfing candle closes above the red open.
How reliable is the piercing pattern?
No candle pattern works every time. Testing it with OddsMaker TI Premium or a simulated account first is a good idea.
What timeframes are there?
5, 10, 15 and 30 minutes.