







 2SmaLa200
Filter
Change From 200 Period SMA (2m) Filter (2SmaLa200)
Find stocks trading above or below the 200-period moving average on the 2-minute chart in real time with Trade Ideas Streaming Alerts (Scanner) and Top Lists (Screeners). The Change From 200 Period SMA (2 min) filter compares the last print to the 200-period simple moving average on a 2-minute chart, in percent. Positive means above the average.
See the cross when it happens, not on tomorrow’s chart.
Free account, just an email. No card. Live access for a limited time.

Streaming Alerts check the Change From 200 Period SMA (2 min) filter the moment each alert fires, and Top Lists can sort by it.
How Trade Ideas finds it: adjust the minimum value to 1 to filter for stocks currently positioned above their 200-period SMA on a 2-minute chart. Set the maximum value to -1 to focus on stocks currently below their 200-period SMA on a 2-minute chart. See Trade Ideas plans and pricing to run it live.
How the Change From 200 Period SMA (2 min) filter works
Trader tip
The "Change From 200 Period SMA (2 min) Filter" is a powerful tool for traders focusing on short-term intraday trading or scalping strategies. By comparing the current price of a stock to its 200-period Simple Moving Average (SMA) on a 2-minute chart, this filter provides insights into the stock's short-term momentum over the last 6.7 hours. It helps traders identify potential entry and exit points based on changes in momentum within a single trading session.
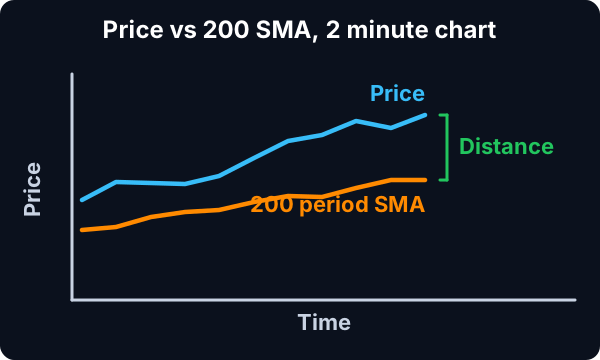
Here’s an in-depth look at how this filter operates:
Simple Moving Average (SMA)200-Period SMA on a 2-Minute Chart: Calculates the average of the closing prices for the last 200 two-minute periods, smoothing out price data over approximately the last 6.7 hours of trading to identify short-term trends.
Calculation: The filter expresses its values in percentage (%), following the formula: Percent Change = ((Last Price - SMA) / SMA) * 100.
Key point
A positive result suggests that the stock's current price is above its 200-period SMA, indicating a potential uptrend. Conversely, a negative result indicates that the current price is below the SMA, suggesting a potential downtrend.
Change From 200 Period SMA (2 min) filter settings
Configuring the "Change From 200 Period SMA (2 min) Filter" is simple and can be done within the Window Specific Filters Tab of the Configuration Window in your Alert or Top List (Screener) window.
Here's how to set up the filter in your configuration window:
- Adjust the minimum value to 1 to filter for stocks currently positioned above their 200-period SMA on a 2-minute chart.
- Set the maximum value to -1 to focus on stocks currently below their 200-period SMA on a 2-minute chart.

Using the Change From 200 Period SMA (2 min) Filter
The "Change From 200 Period SMA (2 min) Filter" can be used in various trading strategies, including:
- Scalping Strategy: Take advantage of short-term price fluctuations by entering and exiting trades rapidly based on changes in momentum relative to the 200-period SMA on a 2-minute chart. Look for opportunities to buy when the price is above the SMA and sell when the price is below the SMA.
- Reversion to Mean Strategy: Identify potential reversal opportunities when the price deviates significantly from the 200-period SMA on a 2-minute chart. Enter trades when the price moves far away from the SMA, anticipating a reversion to the mean.
- Breakout Strategy: Trade breakouts triggered by the price moving decisively above or below the 200-period SMA on a 2-minute chart. Enter trades when the price breaks above the SMA during an uptrend or below the SMA during a downtrend, anticipating a continuation of the breakout momentum.
Filters to combine with Change From 200 Period SMA (2 min)
Categories
FAQ
Which stocks are above their 200-period moving average on the 2-minute chart?
Add the Change From 200 Period SMA (2 min) filter (2SmaLa200) to a Trade Ideas Streaming Alerts or Top List (Screener) window. Adjust the minimum value to 1 to filter for stocks currently positioned above their 200-period SMA on a 2-minute chart. Set the maximum value to -1 to focus on stocks currently below their 200-period SMA on a 2-minute chart.
What is the Change From 200 Period SMA (2 min) filter?
The Change From 200 Period SMA (2 min) filter compares the last print to the 200-period simple moving average on a 2-minute chart, in percent. Positive means above the average.
How do I scan for stocks above an intraday moving average?
Use the Change From 200 Period SMA (2 min) filter (2SmaLa200) in Trade Ideas Streaming Alerts and Top Lists to find stocks trading above or below the 200-period moving average on the 2-minute chart. The Change From 200 Period SMA (2 min) filter compares the last print to the 200-period simple moving average on a 2-minute chart, in percent.