The open, in ten minutes
A Change from the Open race on relative strength leaders shows which stocks take control after the bell, as in the video above.
Turn any Top List (the Trade Ideas stock screener) into a live race. Every stock gets its own lane and moves it as the market moves. Leaders pull ahead, laggards fall back, and you see the whole field without reading a single column.

Named to the Inc. 5000 list of America’s fastest-growing private companies six years in a row (2017–2022).
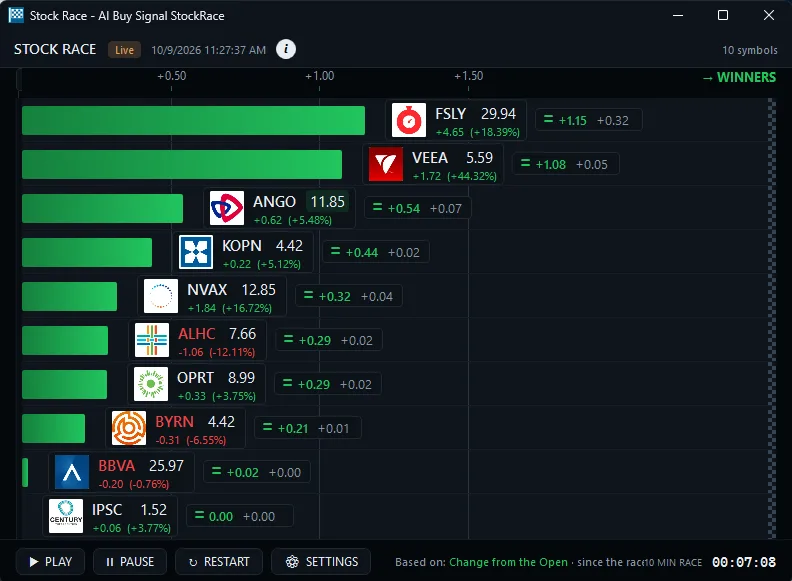
A Top List ranks stocks in a grid. A race shows the same ranking as motion. The Trade Ideas User Guide calls it a way to distill the market action down to its essence and cut the information overload of a spreadsheet: winners up front, losers at the back, the middle of the field in between.
The race reads from a Top List, and you can use any Top List you build from the 249 Top List filters. Top Lists refresh every 15 seconds. When you want each event as it prints, pair the race with Streaming Alerts, which can fire on every trade across 310 alerts.
The race is built on a Top List of relative strength leaders and is based on Change from the Open (%). Four familiar names, TSLA, NVDA, SPY and AAPL, run in the lower lanes, while faster movers such as MGNI, MNSO, PACB and, later, JDST hold the lead lanes. A Last Winner list sits at the finish line on the right, and the 10-minute timer counts down at the bottom. Clicking a symbol in the race loads it into the linked 5-minute and 10-minute charts beside the race, so you can go from the leader to its chart in one click.
Right-click the race and choose Show Race Setup. Stop the race, change what you need, and press Start.
| Setting | What it does |
|---|---|
| Race Lanes | How many stocks run in the race. |
| Based On | Any filter in the Top List. Delta: every stock starts level and the biggest change during the race leads. Total: the highest filter value leads. |
| Sort On | The top-to-bottom order of the lanes, ascending or descending. Delta Value descending ranks the field from the largest gain down. |
| Goal | Time ends the race after the minutes you set. Based on Value ends it when the first stock hits your target. |
| Replace Symbols | Lets stocks that suddenly gain strength replace the runners at the back mid-race, or keeps the starting field fixed. |
| Biggest Loser Wins | For lists of falling stocks such as Down Gappers. Use it with Ascending sort. |
| Auto Re-Run | Starts a new race on the same rules when one ends, and lists each race winner at the finish line. |
| Auto Start | On load, at a set time, or as a replay of the last trading day. Save the race to the cloud first. |
| Replay Mode | Recaps a full trading day in minutes: one minute of replay per trading hour. |
The Config button, or Configure on the right-click menu, opens Quick Settings for the Top List behind the race: minimum and maximum price, today’s volume and 10-day average volume. Advanced opens the full Top List configuration. Save or Share to Cloud keeps your race, and Load from Cloud brings it back.
A Change from the Open race on relative strength leaders shows which stocks take control after the bell, as in the video above.
Base the race on Price (Delta) with a $2.00 goal, and it ends the moment the first stock gains two dollars.
Run Down Gappers or Top Percentage Losers with Biggest Loser Wins and Ascending sort to follow the names falling hardest.
Auto Start Last Day Replay runs the previous session at the time you choose, one minute per trading hour.

Every TI Pro plan. TI Standard ($127 a month or $1,068 a year) and TI Premium ($254 a month or $2,136 a year) both include Stock Races, along with multi-strategy windows, unlimited watchlists and the AI Assistant. TI Premium adds OddsMaker, Money Machine, Holly AI Signals, Smart Risk Levels and the RBI/GBI windows. See current pricing.
Races are also in the Web Dashboard, with Top Lists, TreeMaps and Market Pulse. It runs in any browser; open a free account to try it. TI Pro is a Windows desktop app and runs on a Mac through Parallels.
A Stock Race is a Top List shown as a race. The stocks in your Top List get one lane each and move toward the finish line as the filter you picked changes, so the leaders, the laggards and the middle of the pack are clear at a glance.
Every TI Pro plan, TI Standard and TI Premium. Races are also in the Web Dashboard, next to Top Lists, TreeMaps and Market Pulse. You can open a free account to try the Web Dashboard.
Any filter in the Top List behind it. Pick Delta and every stock starts level, so the biggest change during the race leads. Pick Total and the stock with the highest filter value leads. Top Lists draw on 249 filters.
Yes. That is what a race is. Top Lists are the Trade Ideas stock screener, and any Top List you build, from preset scans like Up Gappers to your own filters, can be shown as a Stock Race.
You set the goal. Time ends the race after a set number of minutes. Based on Value ends it when the first stock reaches a target, for example a $2.00 gain on Price (Delta) or a 50% Change from the Close (Total).
Seeing momentum instead of reading it: which stocks are gaining ground, how fast, and which are fading. In a Stock Race, each stock’s lane position shows how far it has moved on the filter you picked, so momentum leaders and laggards stand out without scanning numbers.
A top gainers list re-sorts rows as prices change. A race keeps every stock in its own lane and moves it forward or back, so you see who is gaining ground and how fast, not just who is on top right now. Base the race on a gainers Top List to watch today’s top gainers live.
Yes. Replay Mode recaps a whole trading day in a few minutes, with one minute of replay for each trading hour. Auto Start Last Day Replay can run the previous day at a time you set.
Yes. Base the race on a Top List of losers, such as Down Gappers, turn on Biggest Loser Wins and sort Ascending.
No. A race is a way to see a Top List move. It shows which stocks are gaining on the filter you picked; the trade decision is yours. Past results, including backtests, don't guarantee future results.