







 MA20P
Filter
Change From 20 Day SMA Filter (MA20P)
Find stocks trading above, below, or near their 20-day moving average, in percent, in real time, with Trade Ideas Streaming Alerts (Scanner) and Top Lists (Screeners). The Change from 20 Day SMA (%) filter compares the last print to the average closing price of the previous 20 trading days, as a percent. A positive number means the price is above the moving average.
See the cross when it happens, not on tomorrow’s chart.
Free account, just an email. No card. Live access for a limited time.

Streaming Alerts check the Change From 20 Day SMA (%) filter the moment each alert fires, and Top Lists can sort by it.
How Trade Ideas finds it: a positive value means the last print is above the 20-day SMA and a negative value means below, so set a minimum above 0 to see stocks above it or a maximum below 0 to see stocks below it. See Trade Ideas plans and pricing to run it live.
How the Change From 20 Day SMA filter works
These filters compare the price of the last print for a stock to the average closing price of that stock for the previous 200, 50, 20, 10, or 8 trading days. A positive number means that the current price is above the moving average. A negative number means that the current price is below the moving average.
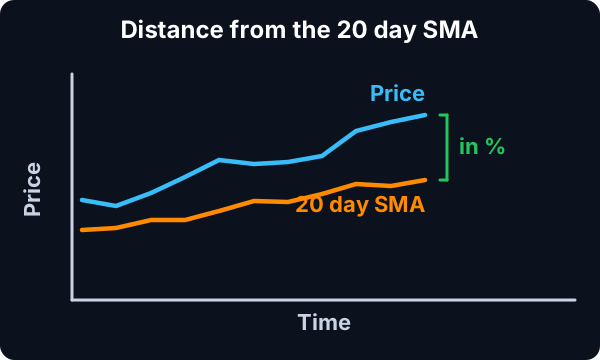
There are two different ways to scale the result. You can look at the difference as a percentage (%) or you can look at it in terms of volatility (Bars). There is no option to look at this in dollars, because that value would vary too much from one stock to another.
Formula
The formula for % is simple. (Percent Change) = ((Last Price) - (SMA)) / (SMA) * 100. This is a common way people look at the simple moving average when they are only looking at numbers.
Volatility is a way of formalizing what we see on a chart. The volatility of a stock is, roughly, the average amount that the stock moves between the close of one 15 minute bar, and the close of the next bar. See our stock screener for the exact volatility of any specific stock. The formula for this filter is (Volatility Weighted Change) = ((Last Price) - (SMA)) / (Volatility).
Key point
The stock screener includes several specific scans related to these filters. The winners and losers by % show the extreme cases that you would find using the percent version of these filters. The winners and losers by volatility show the extreme cases that you would find using the volatility version of these filters. Look at the details of specific stocks in these scans to find good values to use in these filters.
Relevant scans: 200-Day Winners by %, 200-Day Winners by Volatility, 50-Day Winners by %, 50-Day Winners by Volatility, 20-Day Winners by %, 20-Day Winners by Volatility, 200-Day Losers by %, 200-Day Losers by Volatility, 50-Day Losers by %, 50-Day Losers by Volatility, 20-Day Losers by %, 20-Day Losers by Volatility.
Filters to combine with Change From 20 Day SMA
- Change from 20 Day SMA (Bars) filter
- Relative Volume filter
- Position in Range (1 year) filter
- Change from 200 Day SMA (%) filter
- Change from 200 Day SMA (Bars) filter
- Change from 50 Day SMA (%) filter
- Change from 50 Day SMA (Bars) filter
- Change from 10 Day SMA (%) filter
- Change from 10 Day SMA (Bars) filter
Alerts to pair with the Change From 20 Day SMA filter
Categories
FAQ
Which stocks are trading above their 20-day moving average right now?
Add the Change From 20 Day SMA filter (MA20P) to a Trade Ideas Streaming Alerts or Top List (Screener) window. A positive value means the last print is above the 20-day SMA and a negative value means below, so set a minimum above 0 to see stocks above it or a maximum below 0 to see stocks below it.
What is the Change From 20 Day SMA (%) filter?
The Change from 20 Day SMA (%) filter compares the last print to the average closing price of the previous 20 trading days, as a percent. A positive number means the price is above the moving average.
How do I find stocks near the 20-day moving average?
Use the Change From 20 Day SMA filter (MA20P) in Trade Ideas Streaming Alerts and Top Lists to find stocks trading above, below, or near their 20-day moving average, in percent. The Change from 20 Day SMA (%) filter compares the last print to the average closing price of the previous 20 trading days, as a percent.