The OddsMaker is located in a panel with a gray background and black text, in the alert window.
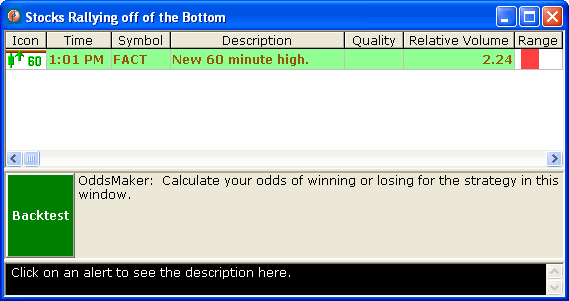
To start the OddsMaker hit the Backtest button. The text to the right of the Backtest button will show you additional information.
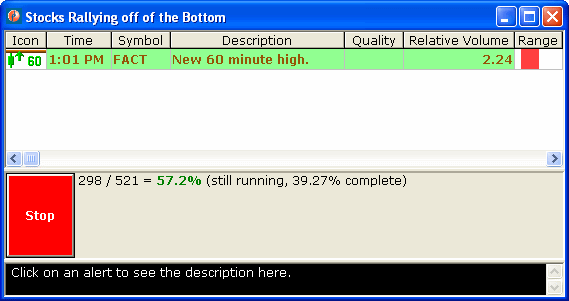
When the OddsMaker is running the Backtest button will change to a Stop button, and some status will appear next to that button. Hit the stop button if you want to abort the current request, perhaps to start a new one. If you allow the current request to complete you will see additional status, and the Stop button will return to a Backtest button.
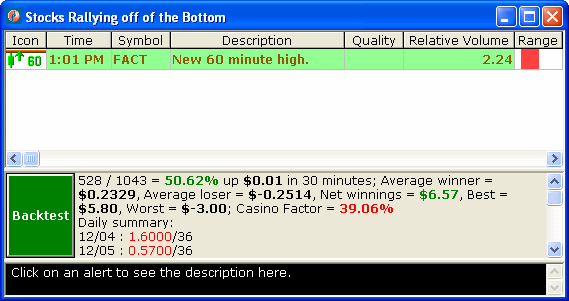
You can drag the bar at the top of the OddsMaker panel up and down to adjust the size (same as the description panel below it). For more details see the video help for the description panel.
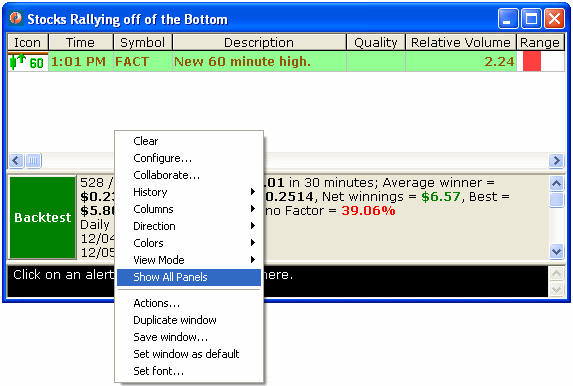
To hide the panel completely, drag the top all the way down to the bottom. To make it visible again, right-click on the alerts and select “Show All Panels” from the pop up menu.
The entry condition is always an alert. The OddsMaker uses the same alert configuration for the entry condition as the rest of the alert window. For more details see the video help for the configuration window.
The alert window can be reconfigured while the OddsMaker is running without there being any effects. The OddsMaker will use the settings that you selected when you hit Backtest and will ignore any new settings until the next time you hit Backtest.
The OddsMaker can use a symbol list which should not be edited while the OddsMaker is running. If you do edit it, results will be inconsistent.
Once you hit Backtest there will be additional choices.
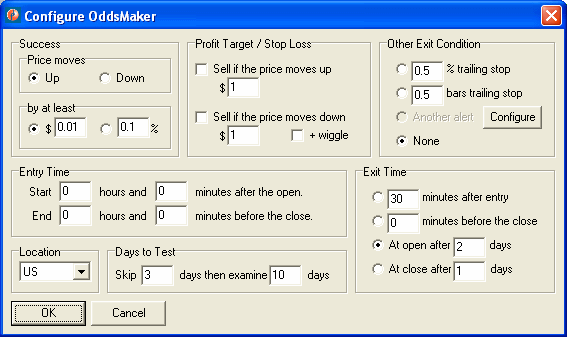

First, select a direction. “Up” means that you plan to buy the stock (i.e. to go long) and you are looking for the price to increase. “Down” means that you plan to sell short, and are looking for prices to decline. This will affect the output in several ways. All of the moves that we report change based on this setting. If a stock moves from $9.00 to $10.00, and you selected “up,” we will report a move of $1.00. On the other hand, if you had selected “down” we would report that same move as $-1.00.
Next you have to select dollars or percent. Select dollars if you typically buy the same number of shares each time you buy a stock, regardless of price. Select percent if you typically buy a specific dollar amount, regardless of the number of shares.
After selecting the direction, you need to select the minimum move size. (See the panel labeled “by at least”.) This is the number of dollars or percent that you want a stock to move either up or down before you consider it a success. It is important to note that this affects some but not all of the fields in the report. More details are listed below.
Below the success criteria is space to specify more about the entry condition. In this picture all four of these boxes are set to 0 which allows you to enter a trade at any time during regular market hours. If you put 30 into the box on the top right, you will not start looking for entries until 30 minutes after the open. If you put 1 into the box on the bottom left, you will not look for any new entries in the last hour of the market.
There are 6 hours and 30 minutes in the trading day. If you only want to trade during the last hour of the market, then say “Start 5 hours and 30 minutes after the open” and “End 0 hours and 0 minutes before the close.”

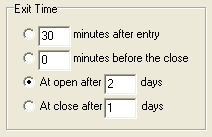
“Exit Time” says when to get out of a trade. You can specify a certain number of minutes for an exit condition using the "minutes after entry" option. This is always rounded to the nearest 5 minute boundary. For example, if you entered a trade at 9:32, and you asked to exit after 30 minutes, you will use the exit price from 10:00. If you entered a second trade 45 seconds later, you will use the exit price from 10:05 for that trade.
If you specify a certain number of minutes for the exit condition, the exit will never go past the end of the current trading day. If you say to exit 30 minutes after the entry, and you enter a trade less than 30 minutes before the close, you will exit that trade at the closing price for the day.
“0 minutes before the close” means to use the closing price for the stock. This is the close on the same day as when you entered the trade.
“At open after 2 days” means to use the opening price from exactly 2 days from the following trading day. “At open after 0 days” would use the opening price from the following trading day. “At close after 1 days” would use the closing price from the following trading day.
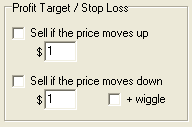
“Profit Target / Stop Loss” gives you additional ways to exit a position. Use the check boxes to select the options that you want. The top one is always the profit target. If the stock moves in the desired direction by this much, you will immediately exit. The bottom one is always the stop loss. If the stock moves against you by this much, you will immediately exit. “Wiggle” is the stock’s 15 minute volatility times its relative volume.
If you set a stop loss or profit target, the OddsMaker will use historical data to estimate the exit price. In real trading there is no guarantee that you will get this price. These estimates can be very unreliable if you set your stop loss too tight. If the stock would have hit the stop loss very shortly after entering the position, we will often show a loss much greater than the stop loss you requested. This is a reasonable guess, based on our tests with real trading.
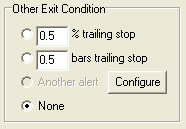
“Other Exit Condition” provides additional ways to exit before the specified time, in certain cases.
“% trailing stop” and “bars trailing stop” will simulate the trailing stop implemented by most trading platforms.
These are based on our stop alerts.
![]()
![]()
![]()
![]() See the help for these alerts for more details.
The OddsMaker automatically chooses the direction of the stop based on the direction of your entry.
See the help for these alerts for more details.
The OddsMaker automatically chooses the direction of the stop based on the direction of your entry.
“Another alert” allows you to select an alert as an exit criteria. Initially this option is grayed out. You need to hit the Configure button to describe the alerts you want before using this option.
“None” means that you will only exit the alert based on time, and optionally the profit target or stop loss.
This allows you to select what markets to use in your backtesting. The currency, market data, and holiday schedule for the selected location will be used in the analysis.


“Days to Test” allows you to select a specific range of trading days. “Skip 3 days then examine 10 days” means that the last three trading days will be ignored, and trades from 10 trading days before that will be used.
Please note that if your exit time is set for a later date then the dates examined will shift to accommodate the exit time. For example, you set “At close after 2 days” as your exit time, in addition to “Skip 3 days then examine 10 days” from above. This will examine trade possibilities starting 5 days ago (2 days exit time + 3 days skipped), and going back an additional 10 days, or 15 days ago. The end dates for these trade possibilities will be from the close 3 trading days ago, and going back an additional 10 days, or 13 days ago.
If you are uncertain or confused, look at the daily summary, described below. This will tell you exactly which days the OddsMaker is looking at.
The panel will show you several facts about your strategy. Let’s take a closer look at a typical results screen:

This means that the OddsMaker found 801 alerts matching the entry specified entry condition. 404 of them achieved or exceeded the specified minimum move size.
This part updates in real time. The rest appears after the analysis is complete.
This is a brief reminder of your requirements. In this case we required that the stock move up at least one penny between the entry and the exit to call it a success. We exited at the open 2 days from the beginning of the next trading day.
Next we look at all the stocks which moved in the direction we wanted. (In this example we were long so the winners are the stocks that moved up.) We display the mean of all of these moves. Note: This analysis does not include the one penny minimum move size that we gave ourselves.
This number will always be positive. If we had gone short, then the average winners field would only consider the stocks which went down. If we were short, and the average winner was $1.23, then that means that these stocks went down an average of $1.23 between the entry and the exit.
If this section is missing that means that there were no winners.
Next we take a look at all of the stocks that went in the opposite of the direction of the actual selection. In this example, we’re looking at the stocks that went down. -1.441 is the mean of all of these stocks.
This is completely analogous to the Average winner. This number will always be negative, it will not appear if there were no losers, and it does not take the one penny minimum move size into account.
Net winnings takes a look at the total amount of money we would have made if we had tried this strategy. If the result is positive, then money was made. If the result is negative then money was lost. This does not take the minimum move size into account. Winning is, quite simply, the difference between the entry price and the exit price.
In this case, if we had bought 1 share of each stock in our strategy, we would have made $7.40. Of course, if we had bought 1,000 shares of each stock, we would have made $7,400.
This result would look different if we had selected percent, instead of dollars, when we first started. In that case the result would say something like “Net winnings = 173.02%”. In that case, if we had bought $100 worth of each stock in our strategy, we would have made a profit of $173.02. Of course, if we had bought $10,000 dollars worth of each stock, we would have made $17,302.
In this case the best of our trades made $34.34 / share. Like the past few values, a positive number means that we made money, regardless of whether we were long or short. This is based only on our entry and exit price, not on the one penny minimum move size.
In this case the worst of our trades lost $18.65 / share.
Best and worst serve as a sanity check on your results. If your best or worst was $1000, and the rest of the numbers were all much smaller, then you probably did something wrong. You probably tried to buy a stock with a ridiculously high price. This is a common novice mistake. One share of Berkshire Hathaway typically moves a lot more every 15 minutes than the entire price of one share of Dell.
This is the chance that your average trade will meet or exceed your minimum move size. In the example above that would mean that the average stock went up at least one penny, so you didn’t lose any money.
This is not just based on the historical average of the trades. It also takes into account the consistency of the historical results. For a simple example, consider a strategy with only two trades. (We wouldn’t really recommend any strategy based on only two trades, but I want to keep this example simple.) Imagine that one trade made 99 cents, and the second trade made $1.01. The average is $1.00, and it’s reasonable to expect future results to look the same. Now imagine that one trade made $101.00 while the other trade lost $99.00. The average profit is still $1.00, but these results were nowhere near each other. You would be less certain of any predictions that you made based on these two trades than based on the first two trades.
This is also based on the number of results. As the number of results grows, our certainty can improve. (If there are too few results, the OddsMaker will not even attempt this type of analysis.) This is what allows a casino owner to know that he’s not going to lose money on his roulette wheel. Even though any one person could win – in fact he has a very reasonable chance of winning – the casino owner is quite certain that at the end of the day the casino will win. He knows this because of the large number of times that people bet on the roulette wheel each day.
This shows the net winnings and the number of trades for each day of history. The net winnings are shown in green if you made money that day or red if you lost money that day.
See the Net Winnings field, described above, for details of this formula. The daily summary does not show the $, %, or - characters, but these are only differences in formatting. The formula is the same as above.
The date listed in the daily summary is the date when you entered the trade. This may or may not be the date when you exited the trade.
The OddsMaker follows very specific rules for entering into a trade. It starts with the earliest alerts and moves to the latest alerts. Typically there are six weeks worth of history in the database. The OddsMaker does not look at any data for the current trading day. It starts looking for the alerts you specify at the time you specify. Once it enters a position for a specific stock symbol, it will not look at that stock symbol again for the rest of the day. It will not enter more than 100 positions each day. Each day starts fresh; you can enter a new trade for the same stock symbol each day.
Some versions of Trade-Ideas use slightly different terminology. “Backtester” is a synonym for “OddsMaker”. “Statistical Confidence Summary” is a synonym for “Casino Factor”. “Start” is a synonym for “Backtest”. These are purely cosmetic changes.
The OddsMaker, like Trade-Ideas in general, does not replace a licensed investment advisor. We cannot, and do not make any guarantees that you will make money. This tool is designed to help manage the large amount of data, but it does not replace sound investment advice.
Successful users mix Trade-Ideas with other tools. Let Trade-Ideas find interesting stocks for you. Then take a look at these stocks with your charts, research, etc., before you make your decision. Use the OddsMaker to help find interesting settings for Trade-Ideas.
